
Puget Systems, which specializes in assembling and selling various PCs for different segments (in other words, a large system integrator), presented interesting statistics on the frequency of failure of certain components.

There are two columns on the graphs below: the store failure rate (in fact, this is the percentage of factory defects) and the field failure rate (and this is already the failure of components in ready-made PCs or servers). The data are given for a long period of time – from 2019 to 2021.
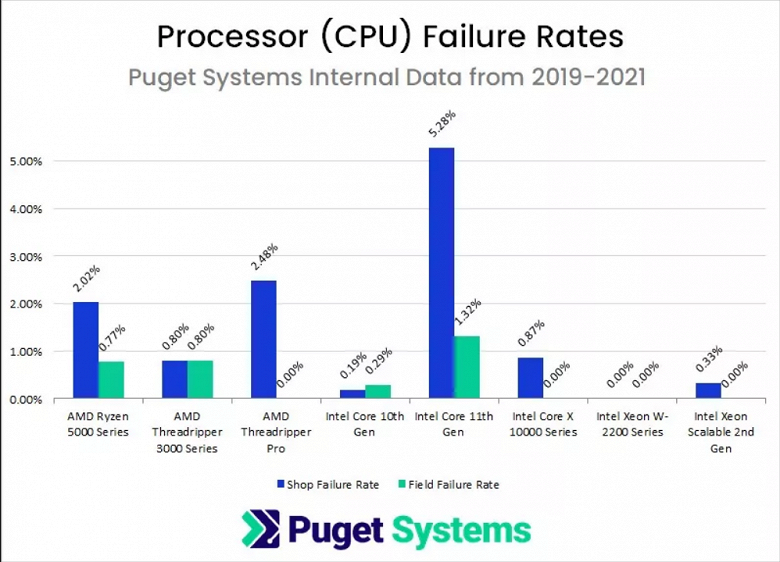
The first graph, with processors, suggests that Intel’s Core 11 is far from being as good as Core 10: the difference in store rejection rates is almost 30 times! Even AMD Ryzen 5000, which repairmen often complain about, fail less often. Although Intel can be praised for the Xeon W-2200 server processors – zero percent of defects or failures.
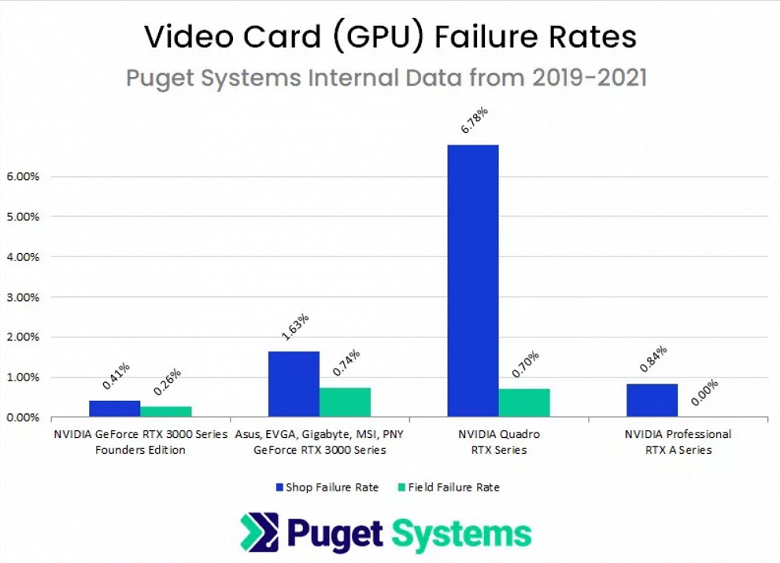
If we look at the Nvidia RTX line of graphics cards, then the most hassle-free consumer solutions are the Founders Edition models. Partner video cards fail more often, but there are more of them on the market than reference video cards.

When it comes to hard drives and solid state drives, Samsung SSDs look very good, especially the 870 series.
.
Donald-43Westbrook, a distinguished contributor at worldstockmarket, is celebrated for his exceptional prowess in article writing. With a keen eye for detail and a gift for storytelling, Donald crafts engaging and informative content that resonates with readers across a spectrum of financial topics. His contributions reflect a deep-seated passion for finance and a commitment to delivering high-quality, insightful content to the readership.


