
The number of bitcoins with “paper” profits has reached its maximum since November 2021, but its average value remains insufficient to form a wave of HODLers closing positions. This conclusion was reached in Glassnode.
The volume of “plus” supply exceeded 16.366 million BTC, which is equivalent to 83.6% of all coins in circulation.
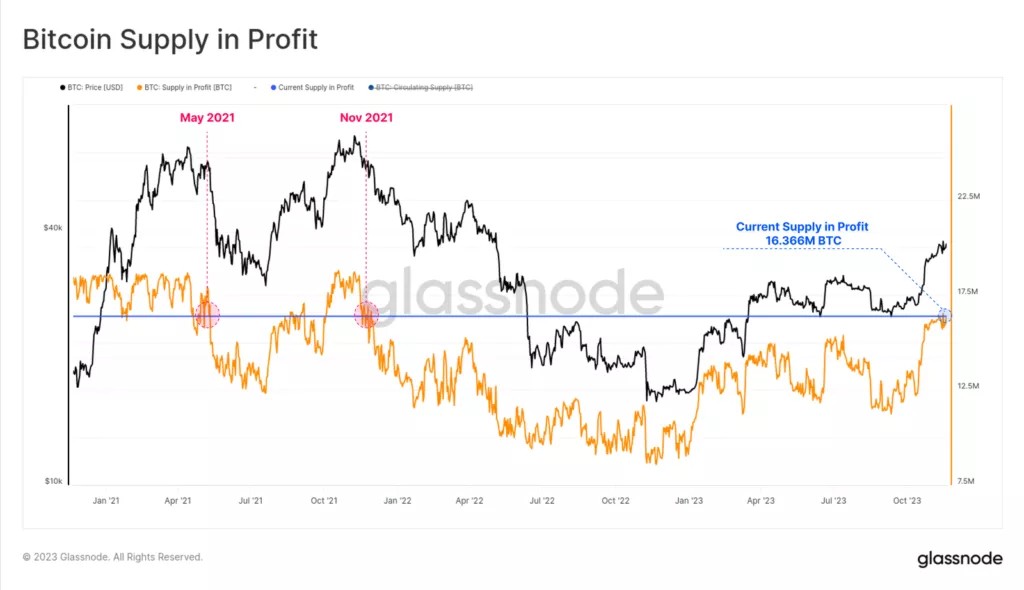
This figure is significantly higher than the all-time average (74%) and is close to one standard deviation (90%). The indicator’s crossing of this level marks the beginning of the euphoria stage of the bull market, experts emphasized.
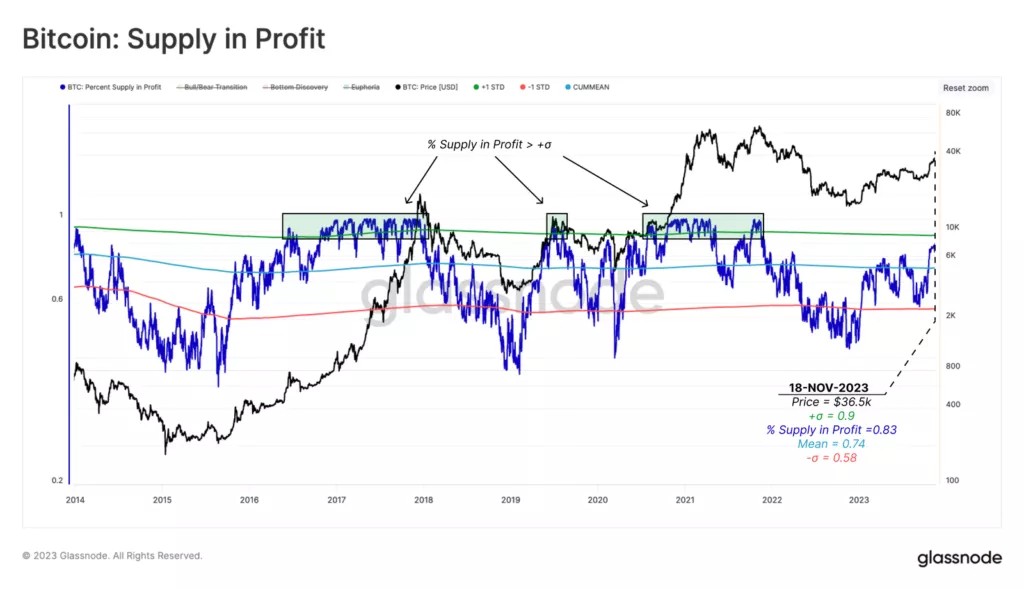
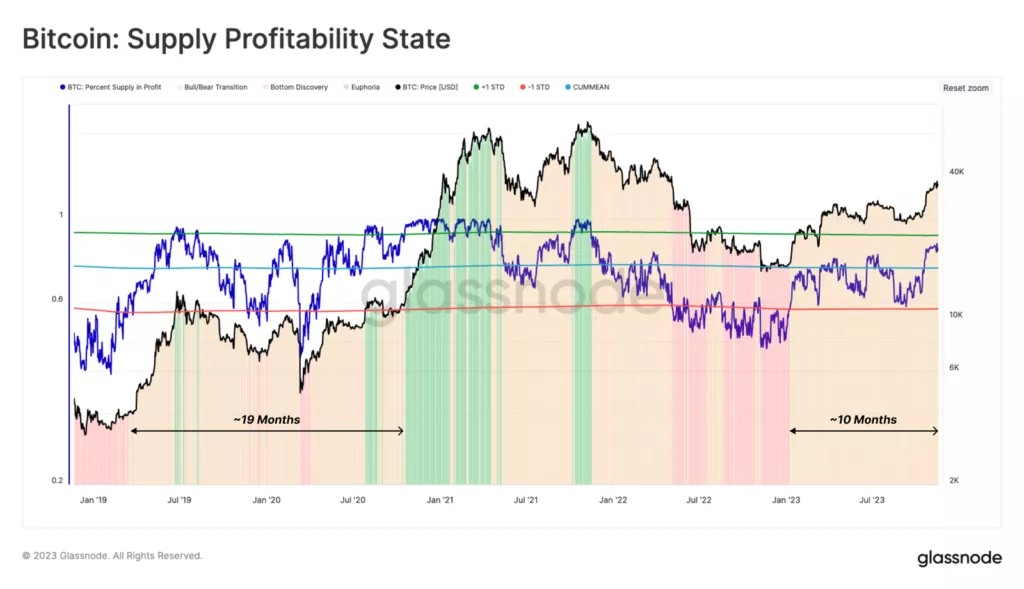
The chart below reveals three typical phases of the profitability cycle over the past five years:
- bottom formation 🟥 when less than 58% (-1 std) coins in circulation bring profit;
- bearish/bullish transition 🟨, when the market recovers from the previous stage (or comes out of euphoria), and the share of bitcoins “in the black” is in the range from 58% to 90%;
- euphoria 🟩 when most coins go into profit as the price reaches ATH (+1 std).
Over the past 10 months, the market has been in a phase of transition from a bearish to a bullish trend. The metric has been below average for most of 2023 (58%), but there has been a sustained breakout since the rally in October.
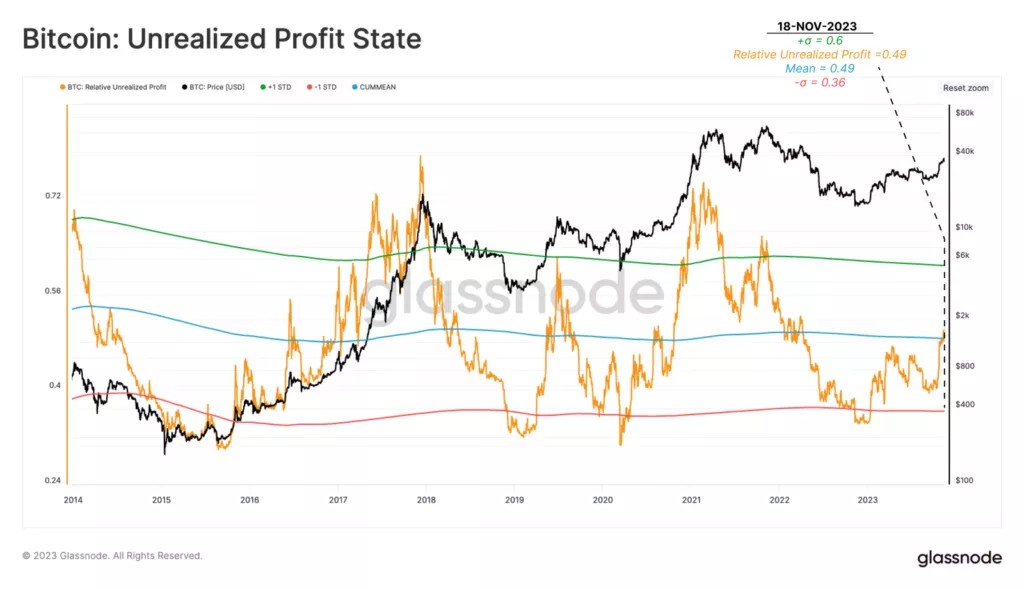
In the following graph of unrealized gains, the analysts have also added the mean and standard deviations. The indicator shows the financial result in relative terms for each dollar invested
Unlike the previous case, this metric has not yet reached the statistically high level that coincides with the “hot” stages of a bull market. It has now returned to the average level of 49%, which is well below the extreme levels above 60% observed during the euphoric phases.
According to analysts, the dynamics of Bitcoin at the disposal of long-term investors are cyclical. They identified different modes of spending models 🔴 and hodling 🟢:
- before returning to ATH offer LTH there is a long period of re-accumulation, with the cumulative value generally remaining unchanged or increasing slightly.
- as the market exits the previous cycle, the incentive to increase spending increases significantly; this is reflected in the sharp reduction in the number of bitcoins in the possession of LTH due to the transfer of coins to new buyers at increasingly expensive prices.
Throughout the 2022 bear market, the first phase followed patterns in the past, with the supply of LTH increasing strongly. The difference from the 2015-16 and 2018-20 cycles is the smoother nature of the trend.
In conclusion, the experts suggested considering 14D—M.A. binary expense indicator for long-term investors (SBI).
By measuring the spending behavior of hodlers, the indicator helps break down the long, rocky path between bear market lows and new trajectories into three sub-intervals:
- bottom formation 🟥, when the spot price trades below the “cost” of LTH;
- equilibrium 🟧, in which the price trades above the “cost” of LTH, but below ATH;
- determining the price 🟩 as the rate breaks above the last two metrics.
Currently, SBI is confirming negligible spending by hodlers, which is an additional sign of supply constraints, analysts said.
The volume of available supply of digital gold has dropped to historical lows, and the “speed” of transferring coins into long-term storage is ~2.48 times higher than the rate of its emission, Glassnode calculated.
Prior to this, experts noted that in anticipation of halving and ETFs, long-term investors had accumulated a record number of bitcoins.
Earlier, JPMorgan analysts called the crypto market rally “excessive” and could end abruptly after the expected approval of a spot exchange-traded fund based on digital gold.
Source: Cryptocurrency
I am an experienced journalist and writer with a career in the news industry. My focus is on covering Top News stories for World Stock Market, where I provide comprehensive analysis and commentary on markets around the world. I have expertise in writing both long-form articles and shorter pieces that deliver timely, relevant updates to readers.


.jpg "From Digitale detox to Diane von Furstenberg’s fork: curiosity and anecdotes from Bezos wedding")

