
Gradually assembling the smart home system, I realized that temperature and humidity indicators alone are not enough, and I also need to monitor the air quality. There is a need for at least a sensor to monitor the CO2 level. This is a rather important indicator that affects a person’s condition throughout the day and directly affects productivity – the more carbon dioxide in the air, the more tired and drowsy.
My entire existing ecosystem is tied to HomeAssistant (or HAss for short), thanks to which I was able to throw all smart devices into HomeKit and control it through the standard Home app from Apple. Therefore, I wanted to get not just an autonomous station with a screen, but a sensor that could work in conjunction with the rest of the equipment.
The lack of HomeKit support for inexpensive sensors and high prices for the same devices with the necessary technology prompted the idea to assemble a device for measuring CO2 levels on our own. It really cost a lot cheaper (and more interesting) than buying a ready-made solution. For example, the popular stations Netatmo Urban Weather Station and Kaiterra Laser Egg + CO2 cost from 10 to 20 thousand rubles, while the sensor with a board cost me 1800 rubles. However, as always, there are some drawbacks.
Since I mentioned HomeAssistant above, I should immediately warn that the output will not be an autonomous solution, but a device that works only in conjunction with a smart home system, which, however, can be installed for free on any constantly working computer.
What do you need
To assemble the device and its normal operation, you will need the following list of items:
- Raspberry Pi or PC with HomeAssistant – the device will be connected to it and all readings will be displayed there. A single-board device is best suited for this, because it consumes less electricity and does not make noise;
- sensor MH-Z19B – needed to obtain air indicators. It, like everything else, can be found on AliExpress, but you have to be careful not to get fake. The “correct” MH-Z19B features a green PCB and a round boss on top;
- microcontroller NodeMCU32-s – a CO2 sensor is connected to it, and it, in turn, to HAss;
- wires for connection – will help in connecting the pins of the sensor and the board;
- prototype board (optional) – sometimes simplifies the connection between the sensor and the board;
- microUSB cable for powering the board – NodeMCU32-s with a sensor are powered from a network or a PC.
Connecting components
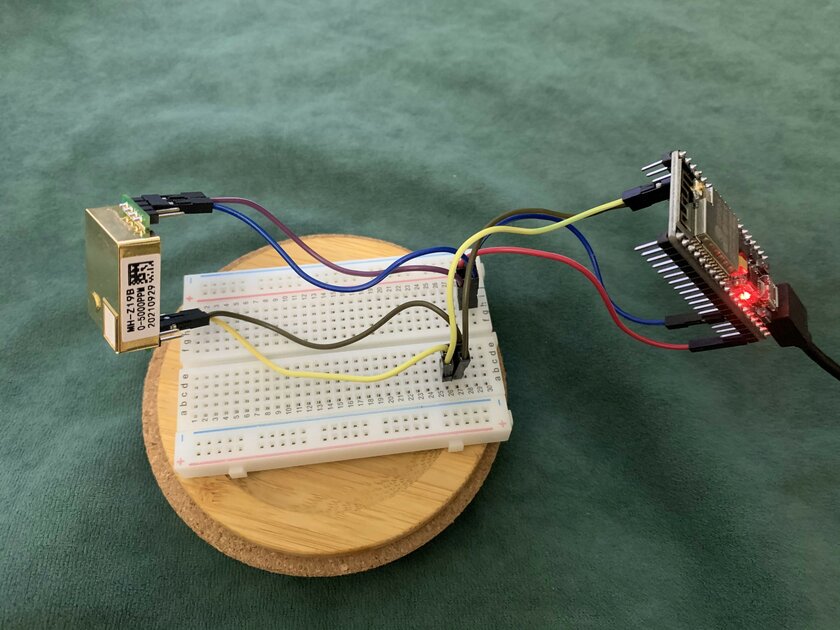
First, you need to connect the sensor to the board. I will warn you right away that sometimes the board is not flashed with a connected MH-Z19B sensor, so I advise you to go straight to the next section and return here after flashing NodeMCU32-s.
If the board is successfully flashed, you can disconnect it from the network and connect the sensor pins to it, as shown in the picture above. You can use the breadboard as an interlayer – I did just that, because I only had wires with one input and one output contact available. The “interlayer” can be removed if there are wires with two input contacts.
Here is one of the nuances that I talked about at the very beginning – the look of the assembled device is sloppy, so you have to create a case from scratch by printing it on a 3D printer or making it from scrap materials.
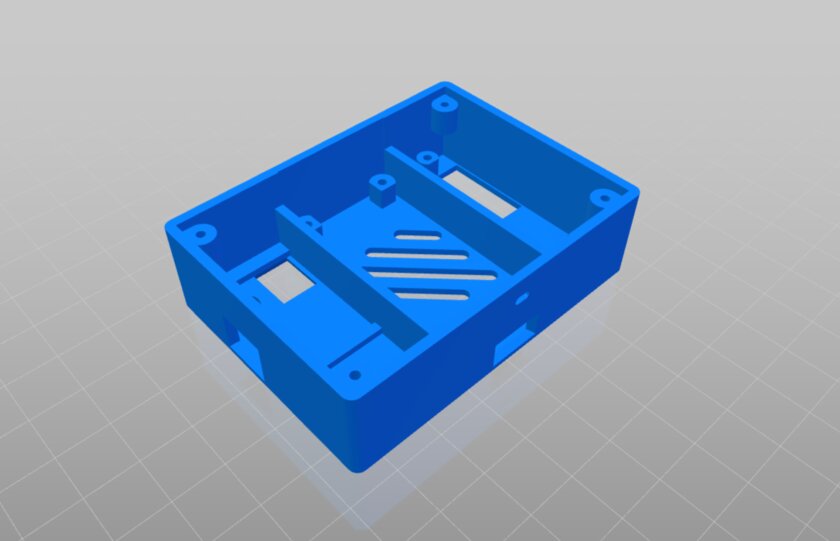
You can look for ready-made solutions on the network, but I managed to find only a case for two sensors. Since the second sensor is not used in this project, such a layout is too large – it needs to be improved.
As soon as the sensor is connected to the board, you can reconnect the microUSB cable for power supply and continue the software configuration.
Configuring the software part
I assume you already have HomeAssistant installed and configured, so I’ll start right away by installing the extensions. If this is not the case, then you can find the installation guide on the official website.
Installing ESPHome in HAss
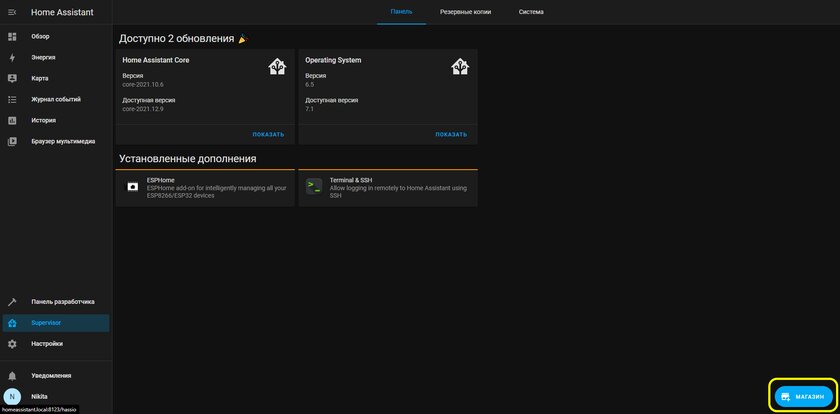
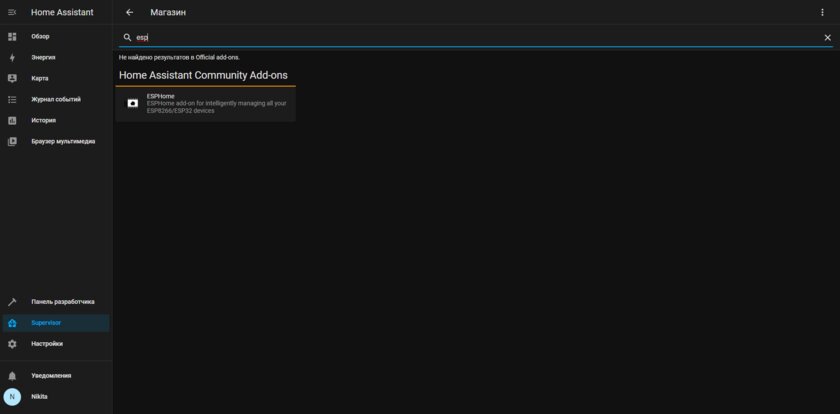
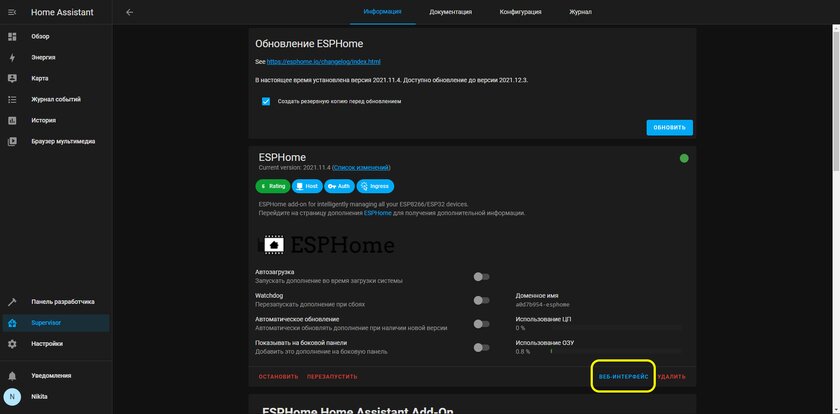
The ESPHome add-on makes life a lot easier, so in the HAss web panel, open the Supervisor section, click on “Store” at the bottom and look for the desired name. After installation, in the same Supervisor section, click on the addon that appears and open the web interface. There I created a YAML configuration file for subsequent compilation of the firmware.
Creating a YAML file
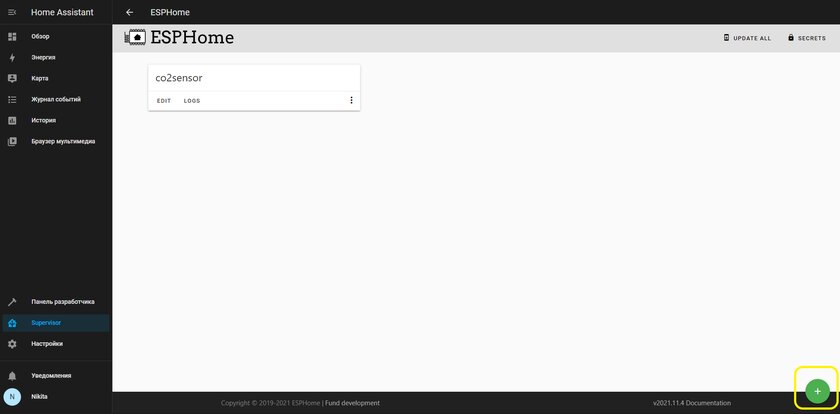
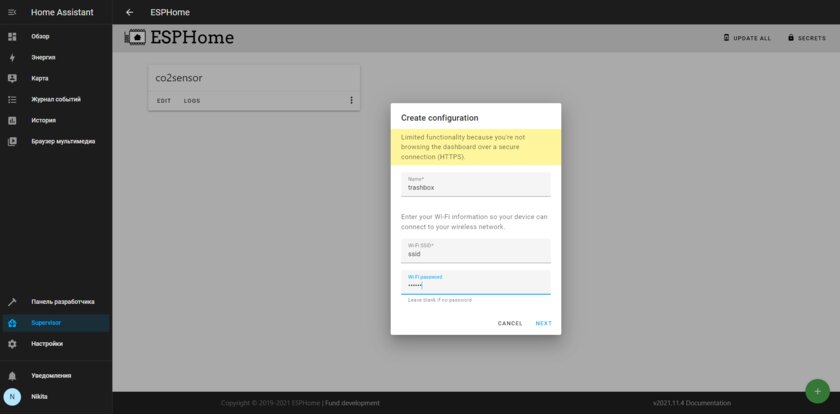
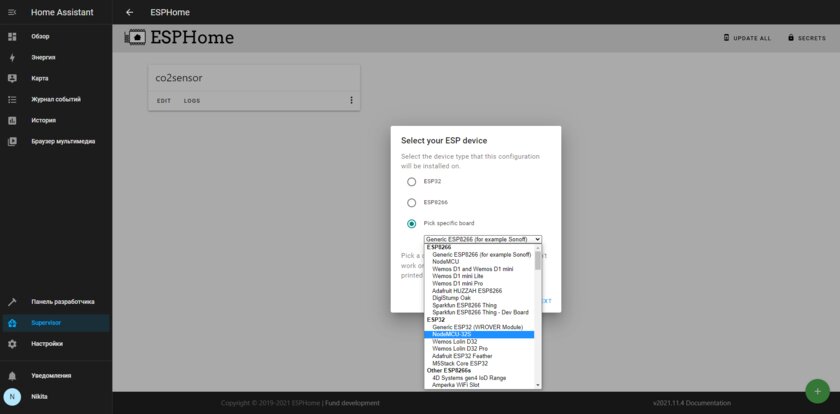
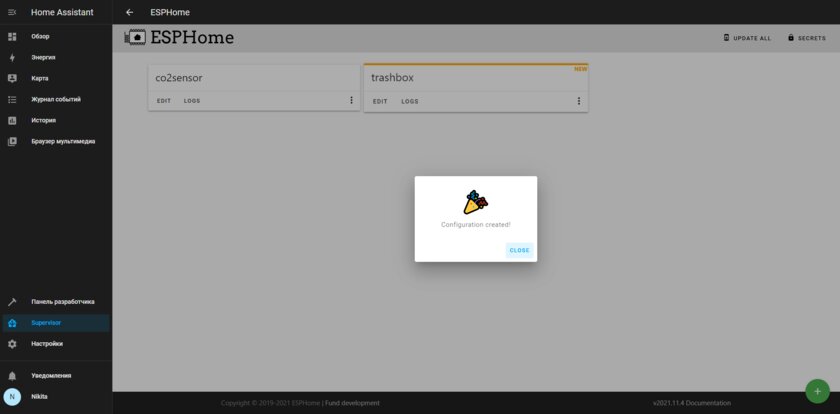
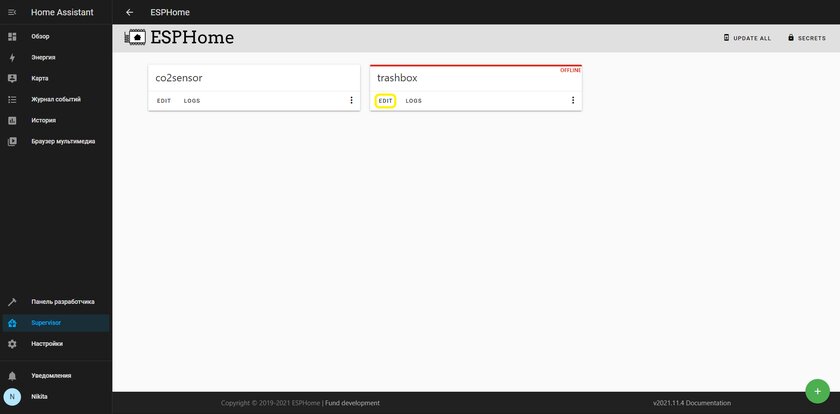
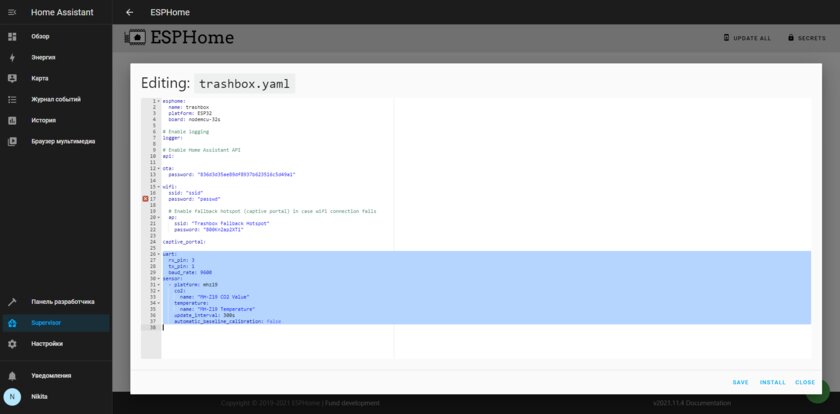
Pressing the “+” button, enter any device name, name and password of the network to which the device with HAss is connected. It is desirable that there are no spaces in the SSID, and the network operates in 2.4 GHz mode. At the next stage, select the Pick specific board item and look for NodeMCU-32S in the drop-down list. After creating the card, press Edit and add the following text to the end:
uart:
rx_pin: 3
tx_pin: 1
baud_rate: 9600
sensor:
– platform: mhz19
co2:
name: “MH-Z19 CO2 Value”
temperature:
name: “MH-Z19 Temperature”
update_interval: 300s
automatic_baseline_calibration: false
Number of seconds per line update_interval can be selected as you like, this is the CO2 data refresh rate. For me, 5-10 minutes turned out to be the most optimal, since the graph turns out to be accurate, but not overloaded with unnecessary data – the CO2 deviations are not so sharp.
Compiling the firmware
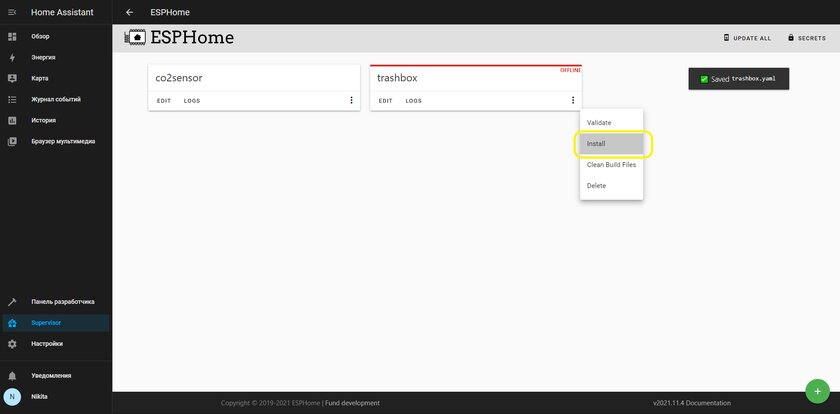
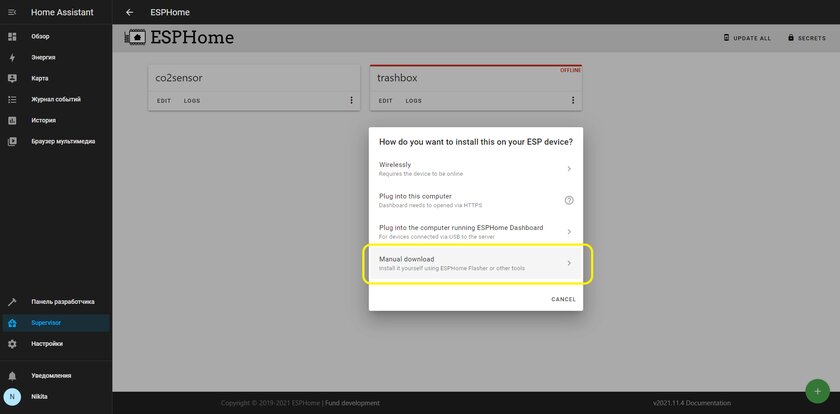
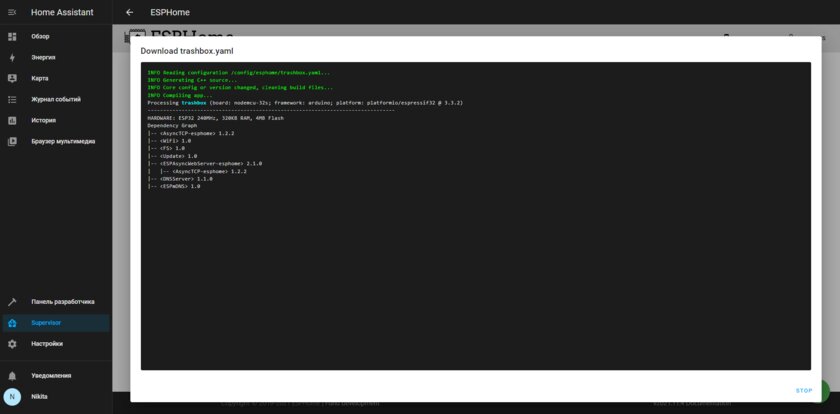
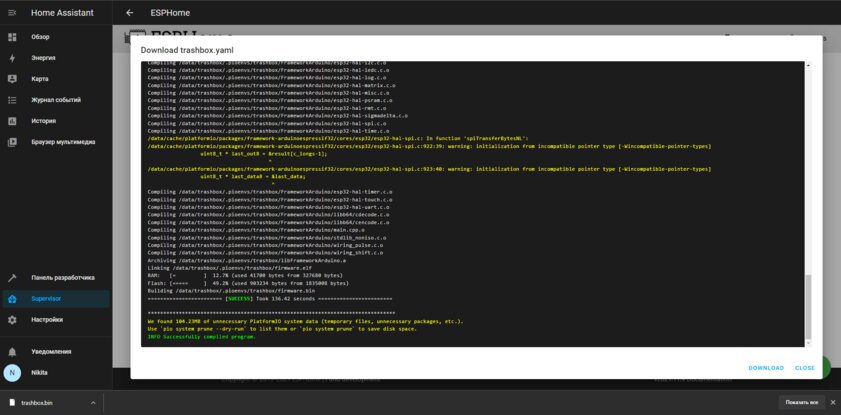
By saving the file, you can compile the firmware based on the configuration you just created. Open the menu by clicking on the three dots in the device card, select Install and then Manual Download. A console will open, which will display the entire process of compiling the firmware – if it was successful, the bin file will be automatically downloaded to the computer. It took me just over two minutes to compile with the Raspberry Pi 4.
ESPHome-Flasher firmware
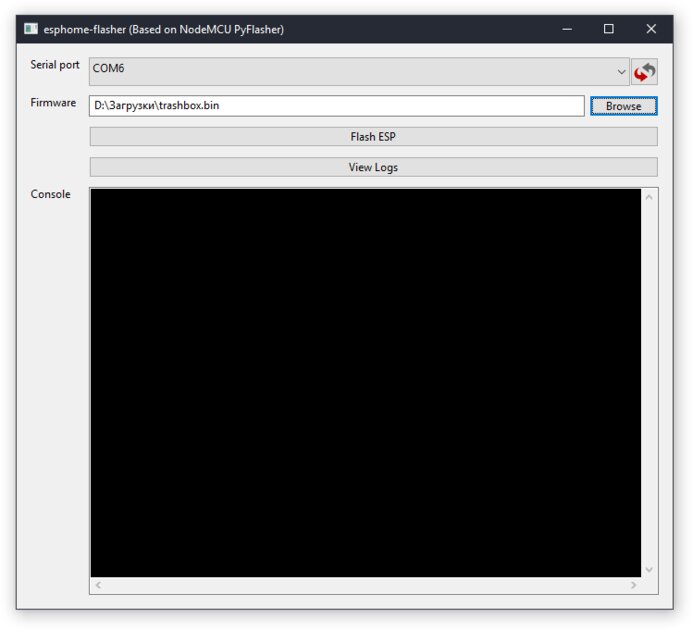
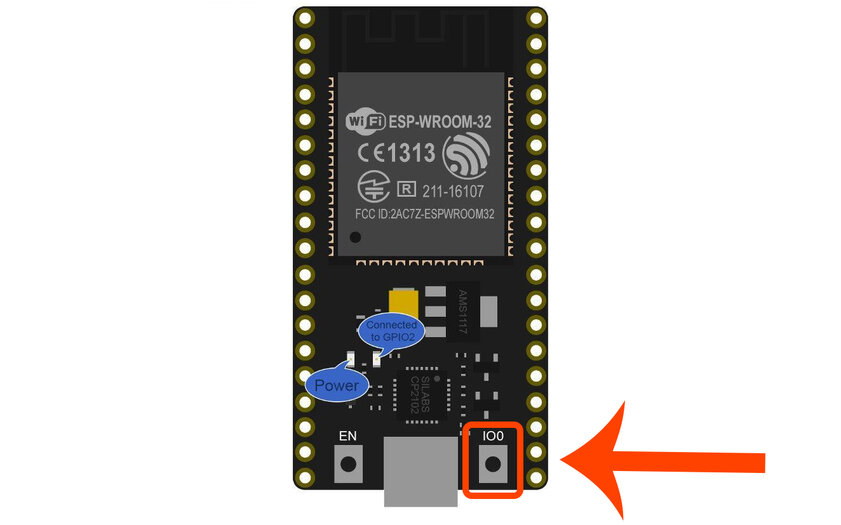
Download the ESPHome-Flasher program to the same computer and run it by connecting the NodeMCU32-s board via USB. Select the previously downloaded bin-file in the Firmware line, and in the Serial Port section – the port with the connected board. Hold the button on the right of the USB port on the microcomputer, and without releasing it, press Flash ESP in the program. Keep holding until you get a successful flashing message.
Awakening of the sensor in HomeKit
In order for the data from the sensor to come not only to HomeAssistant, but also to be available from the Home application on an Apple device, you need to set up a bridge if you are setting up a smart home system for the first time. If this is not the first third-party smart device in the house, then it probably already exists, and you just need to add a new sensor.
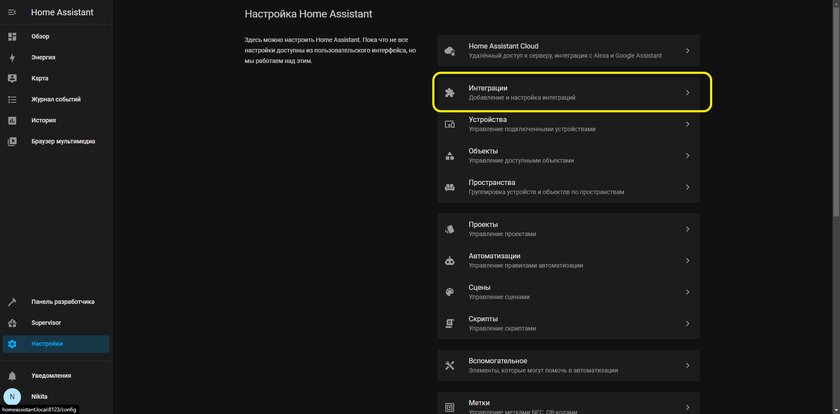
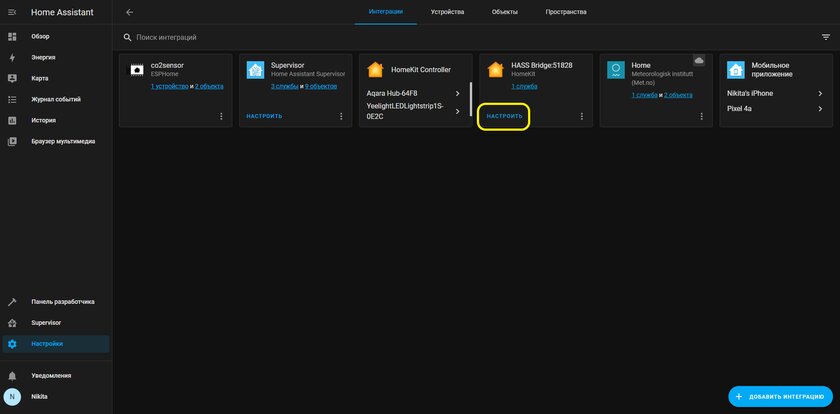
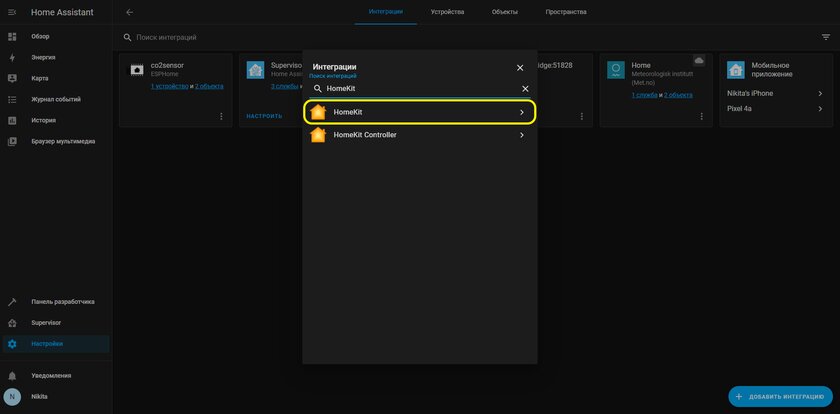

In the first case, go to HAss ‘Settings’, then open the ‘Integrations’ section and click ‘Add HomeKit Integration’.
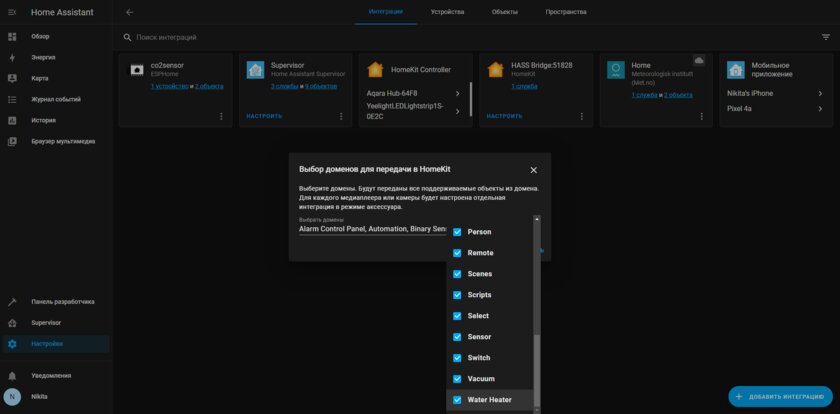
- Select the devices you need (you can put flags everywhere and remove unnecessary ones later), confirm.
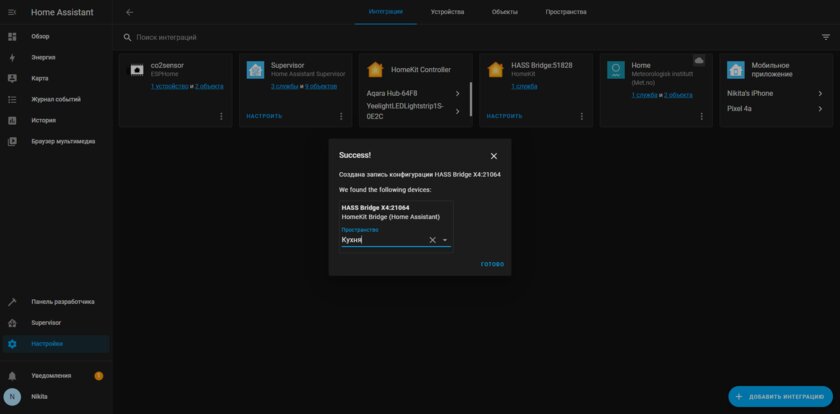
- Mark the desired area in the house where the sensor will be located (this point is not particularly important).
- The most important step is to open Notifications. There you will see a QR code.
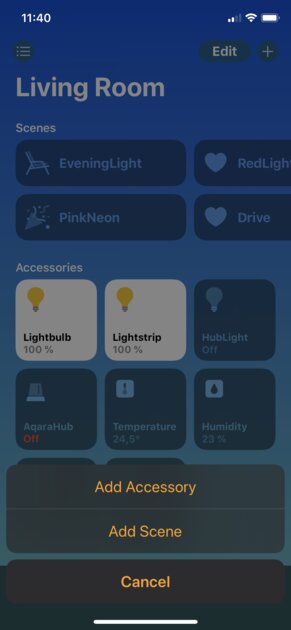
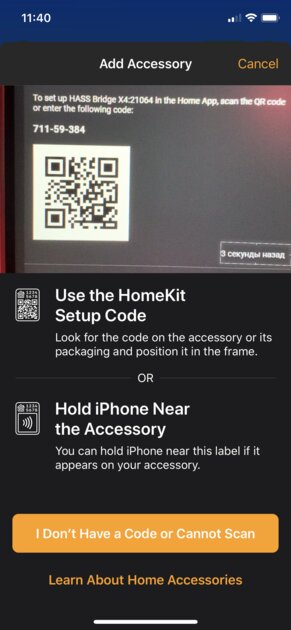
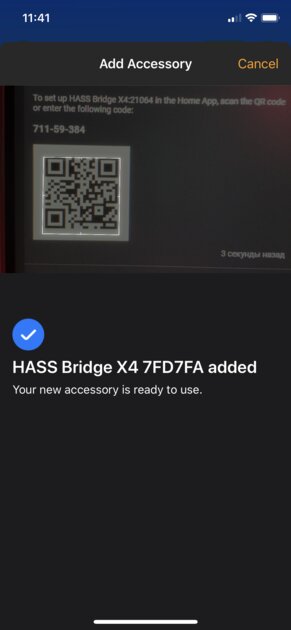
- In the Home app on your iPhone or iPad, tap the + button and then Add Accessory.
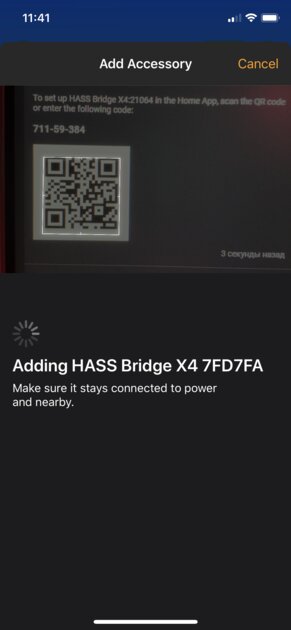
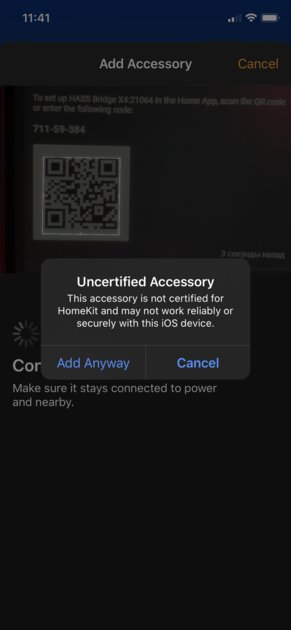
- Scan the QR code, follow all the steps indicated.
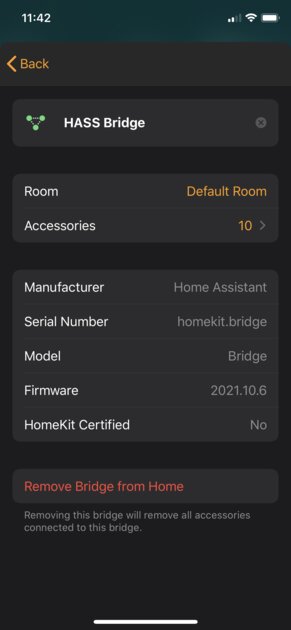
Once the bridge is configured (or if it was before), go to “Integrations” again.
- Find the card with the HASS Bridge device.
- On it, click the “Configure” button.
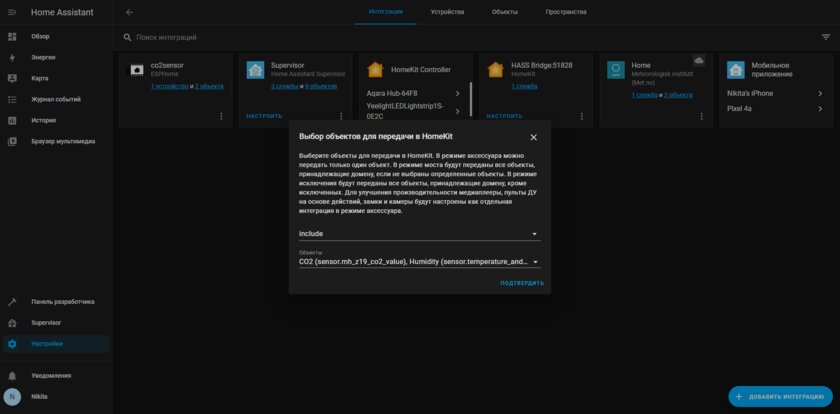
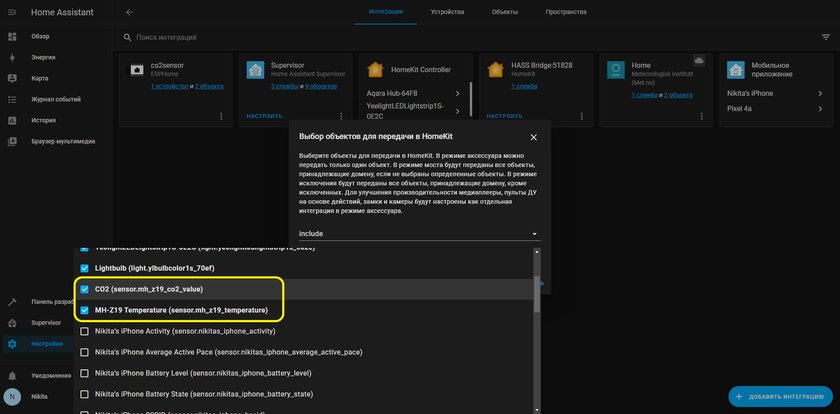
- Skip the first point with the “Confirm” button.
- In the second step, select the Include field in the upper field, and the CO2 and MH-Z19 Temperature objects in the lower one, and then confirm again.
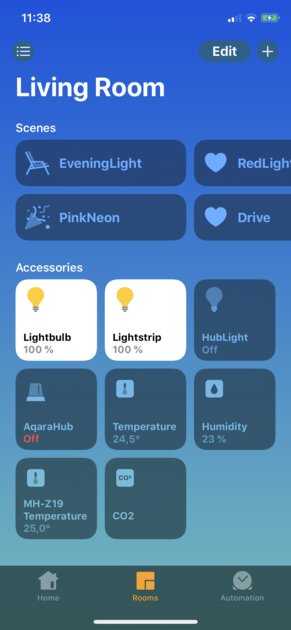
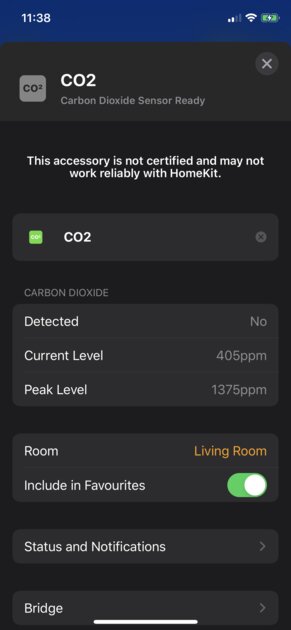
Following these steps should add two new accessories to the Home app – CO2 and temperature sensors. The latter indicator does not differ in accuracy, but according to experiments in the network, the sensor shows CO2 quite correctly.
Adding a graph to the HomeAssistant main panel
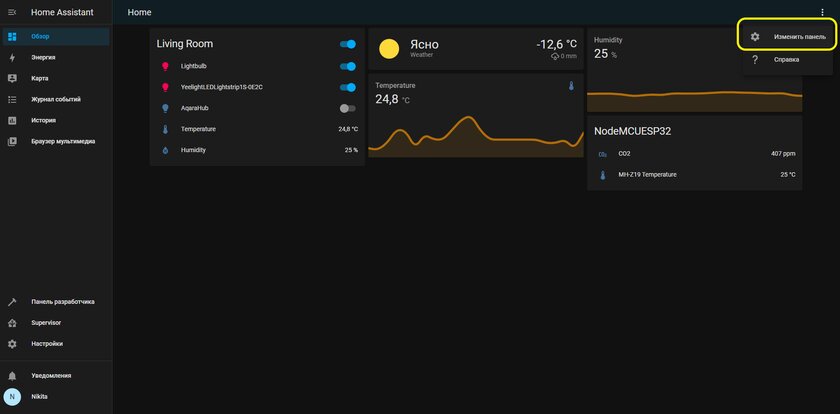
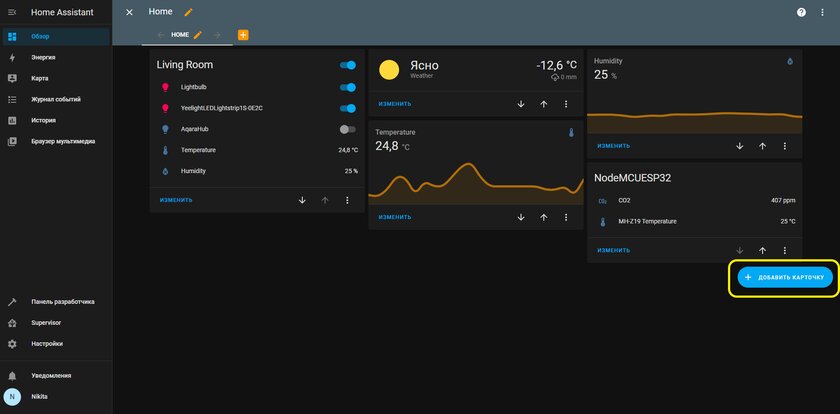
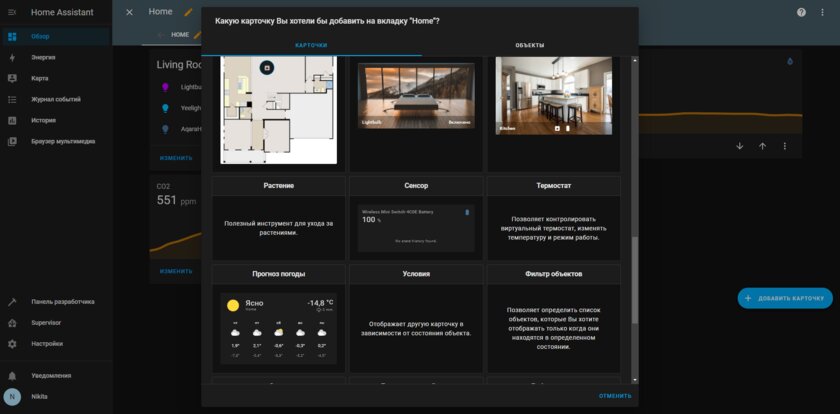
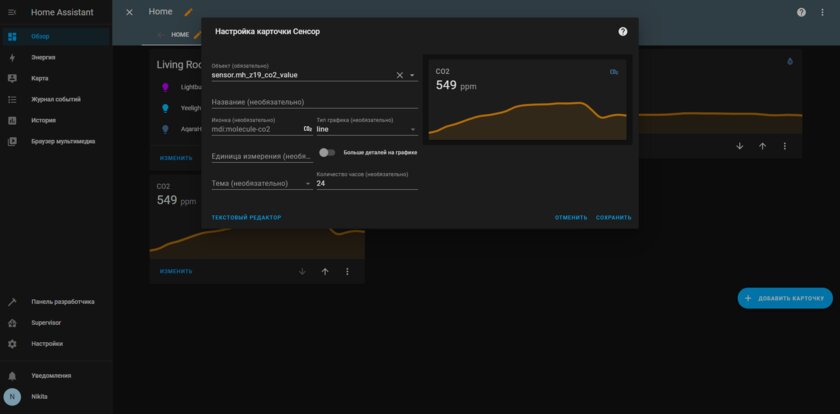
You cannot explore the graph in Apple’s Home app, but you can do it in the HomeAssistant app or web panel. On the main page “Overview” open the menu and there click “Change Panel”, and then click on the button “Add Card”. Find “Sensor” and in the “Object” field select CO2.
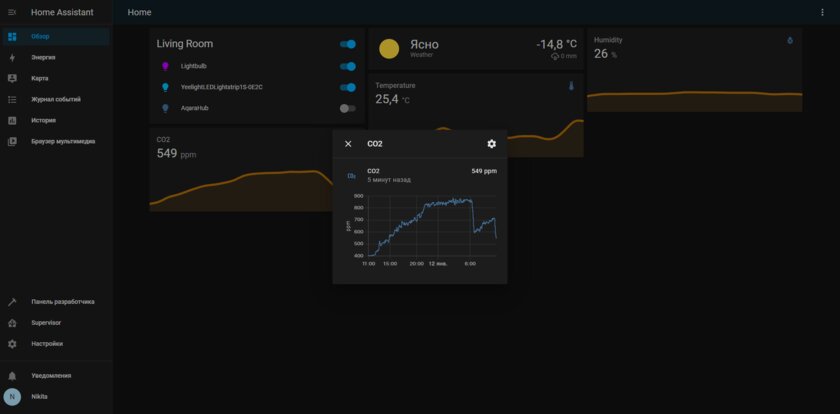
The main graph will be in a simplified form, but if you click on the line with the sensor name, a more detailed version of the historical data will open.
Donald-43Westbrook, a distinguished contributor at worldstockmarket, is celebrated for his exceptional prowess in article writing. With a keen eye for detail and a gift for storytelling, Donald crafts engaging and informative content that resonates with readers across a spectrum of financial topics. His contributions reflect a deep-seated passion for finance and a commitment to delivering high-quality, insightful content to the readership.


