What is RSI
Relative strength index (abbreviated RSI) or “relative strength index” is one of the indicators that are used in cryptocurrency trading. It belongs to the group of oscillators. This means that its main purpose is to measure price fluctuations.
RSI was first described by John Welles Wilder Jr. in the late 1970s. This is the same author who described the ATR indicator.
By default, RSI is calculated over 14 days. But it is not a direct indication of action when trading. You can easily change it to whatever value you want. Some prefer the shorter 5-day RSI, while others prefer the longer 25-day RSI. It all depends on your trading style.
So how to calculate RSI?
RSI Calculation
Before calculating RSI, RS (relative strength) is calculated – relative strength. To calculate, you need to know: how many days during the considered period of time the growth lasted, and how many the fall. Next, the average price of growth and the average price of decline are calculated. In this case, the calculation may be different. Wilder himself preferred to use a smoothed moving average. However, the use of exponential is also acceptable. In a number of sources, you can find the calculation of RS through a simple average.
The RSI itself is calculated using the following formula:
RSI = 100 – (100/(1+RS)
It is worth noting that only fans of mathematics will be interested in manually calculating RSI. In real trading of crypto assets, no one will do this. Almost any application or platform automatically calculates RSI.
So, we have calculated the relative strength index. And how to use it for trading?
Oversold and overbought
RSI ranges from 0% to 100%. It is believed that if the indicator climbs into the zone above 70%, then this or that asset will rise to the overbought zone. This means that the price of the goods is too high, and a correction should begin soon. Accordingly, if the RSI falls below 30%, then we enter the oversold zone. This indicates an unreasonably low price of the cryptocurrency and is a harbinger of an imminent growth.
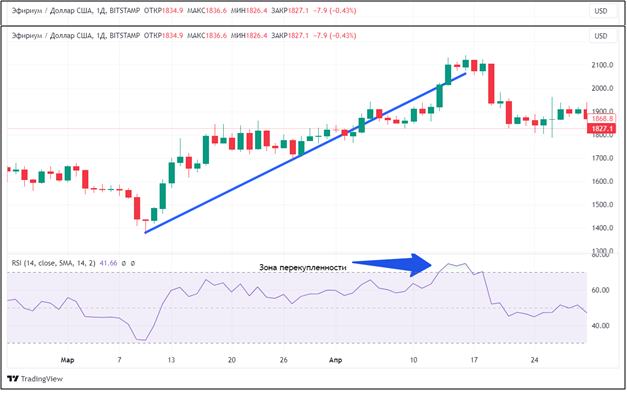
Let’s look at a real example. From March 10 to April 16, Ethereum showed good growth, adding more than 50% in price. At the same time, RSI warned crypto enthusiasts on April 14 that a change in trend could be expected soon. It was on that day that the index entered the overbought zone. And starting from April 17, the picture completely changed and the air began to decline.

Source: tradingview.com
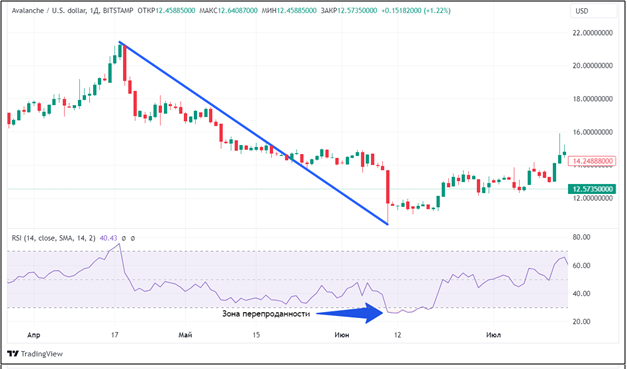
Let’s look at an oversold example on the Avalanche chart. In 53 days, from April 18 to June 10, 2023, the AVAX token fell in price by more than 53%. In June, the RSI announced that market sentiment had changed, moving into the overbought zone. A month later, AVAX added more than 50%, rising from $10.5 to $15.9.

Source: tradingview.com
It is worth noting that the levels of 30% and 70% are classics that Wilder proposed in the late 70s. In practice, things can be much more complicated. This is especially true for the cryptocurrency markets. For each specific instrument, you need to select your own levels, and see what results you will show in trading.
You should not think that the levels should be equidistant, like Wilder’s, when the levels are 30% from the high and low. You can use 85% for oversold, for example, and 20% for overbought. It all depends on your preferences and price action.
But not only overbought and oversold traders are looking for with the help of RSI. There is another important graphical signal – divergence.
RSI divergence
In simple terms, this is a situation where the price and the indicator are in opposite directions. There is a bullish divergence when the price shows a new low, but the RSI stops falling, and a bearish one, when the price of the cryptocurrency shows a new high, but the relative strength index does not. By the name, you can understand that the first variation is a buy signal, and the second one is a sell signal.
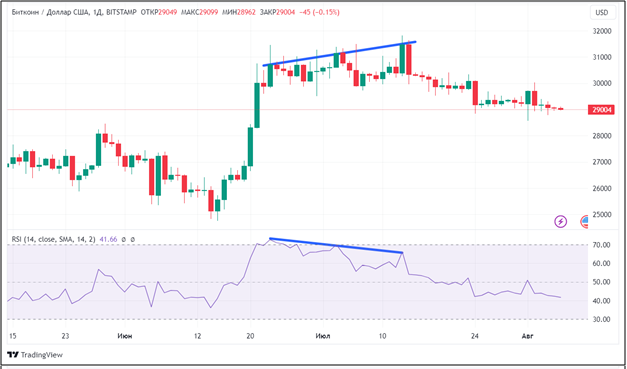
For example, not so long ago, a pure bearish divergence was observed in Bitcoin. On July 13, BTC hit a new high, but the RSI that day was below the June 23 levels. Thus, there was a divergence. Interestingly, on June 23, the RSI also entered the overbought area, which added to the divergence of strength.

Source: tradingview.com
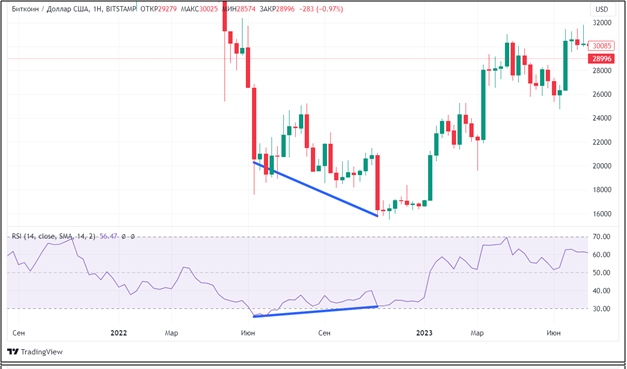
We find a bullish divergence in the same bitcoin, only on the weekly chart. In June 2023, the RSI hit its low. The price of bitcoin fell until November, but the indicator began to grow. That is, a bullish divergence has formed. As we already know, Bitcoin more than doubled after that.

Source: tradingview.com
It would seem that RSI is a great indicator: look for divergences, overbought and oversold conditions. And you will earn. But not everything is so simple. The indicator has a number of disadvantages.
Disadvantages of RSI
The RSI can be quite useless when there is a strong trend in the cryptocurrency. For example, if a long rapid growth begins, the indicator is able to quickly rise above 70% (or another level you set), indicating oversold. As a result, you will sell, and the cryptocurrency will continue to grow.
The second disadvantage of RSI is that it does not provide clear entry and exit points. By and large, this is such a rough indicator. You can verify this from the example above. The divergence has been forming for almost five months. Not every trader has the nerve to withstand so much. Especially if someone entered with leverage.
Also, RSI should not be used for price analysis alone. It is more effective in combination with other technical and fundamental analysis tools. It is worth saying that this cannot be fully attributed to the shortcomings, since there are no indicators that would give 100% results.
To summarize: RSI is a technical analysis indicator from the group of oscillators. Often, it can give signals about a change in the situation in a particular cryptocurrency. However, it does not show exact entry points. The strongest RSI signals are: divergence, oversold and overbought.
This material and the information in it does not constitute individual or other investment advice. The opinion of the editors may not coincide with the opinions of the author, analytical portals and experts.
Source: Bits
I am an experienced journalist, writer, and editor with a passion for finance and business news. I have been working in the journalism field for over 6 years, covering a variety of topics from finance to technology. As an author at World Stock Market, I specialize in finance business-related topics.


