Channel Keltner is a unique tool used by technical analysts. It allows you to get an idea of the current trend in one or another cryptocurrency, as well as evaluate the volatility of the expansion and narrowing of the indicator.
Building the Channel Celtner
Channel Keltner consists of three lines. The average represents the exponential average. Usually they use a twenty -day option, but this is not ultimate. You can change both the period and the nature of the average, for example, use the usual instead of exponential.
The second and third lines are built using the ATR indicator – the average true range. It is a difference between the minimum and maximum price at a given period of time. To build the upper line, two ten -day ATR are added to the exponential medium, and to build the lower, they subtract. Parameters may vary depending on the trading system. The same multiplier for ATR can be different from two.
In practice, manual calculation of the lines for the Keltner channel does not make sense. On all trading platforms where the indicator is available, the construction will be carried out automatically. The only thing to enter is the parameters for the exponential (simple) sliding average, as well as for ATR. After that, you can start trade.
Trading using an indicator
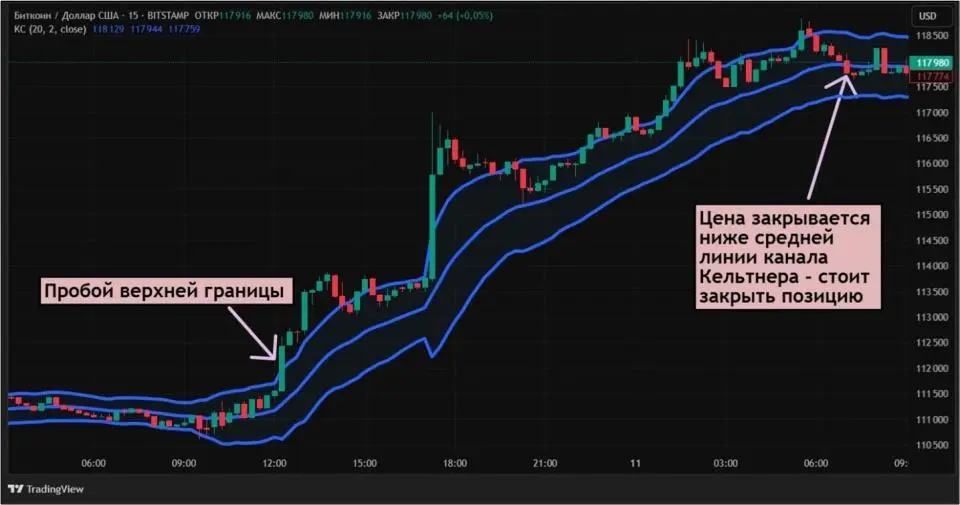
There are several strategies that are applicable using the Keltner channel. The simplest of them is the broken. It consists in the fact that when the price closes above the upper line, the purchase occurs. Further, while it remains on the exponential average, no action is taken, and as soon as it leaves below it, it is immediately sold.
A similar situation is observed at the lower border. Only with her breakdown, the trader does not make a deal for the purchase, but for sale. Holding the position will occur until the price rises above the midline of the Keltner channel.
For clarity, we turn to the 15-minute bitcoin schedule on the Bitstamp exchange. On July 10, a breakdown of the upper boundary of the Keltner channel occurred. Further, for almost nineteen hours, the price did not go below the midline of the indicator. Only on July 11 it closed below – it was then that it was worth leaving the deal. As a result, it was possible to earn more than 4.5%.

Source: TradingView.com
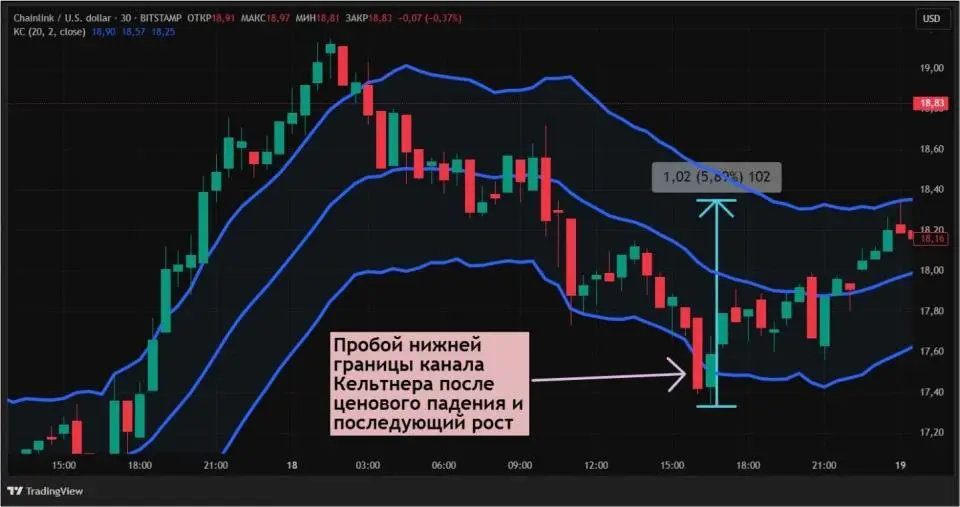
There is also a jack strategy. Here everything happens exactly the opposite. If the price after growth goes beyond the upper boundary of the Keltner Canal, then it is worth selling, and if you buy for the lower after falling, then buy it.
For example, most of the day on July 18, the CHAINLINK course fell. This continued exactly until the moment when the price did not go beyond the lower border of the Keltner channel on a 30-minute graph. After that, until the end of the day, Chainlink added more than 5.5%.

Source: TradingView.com
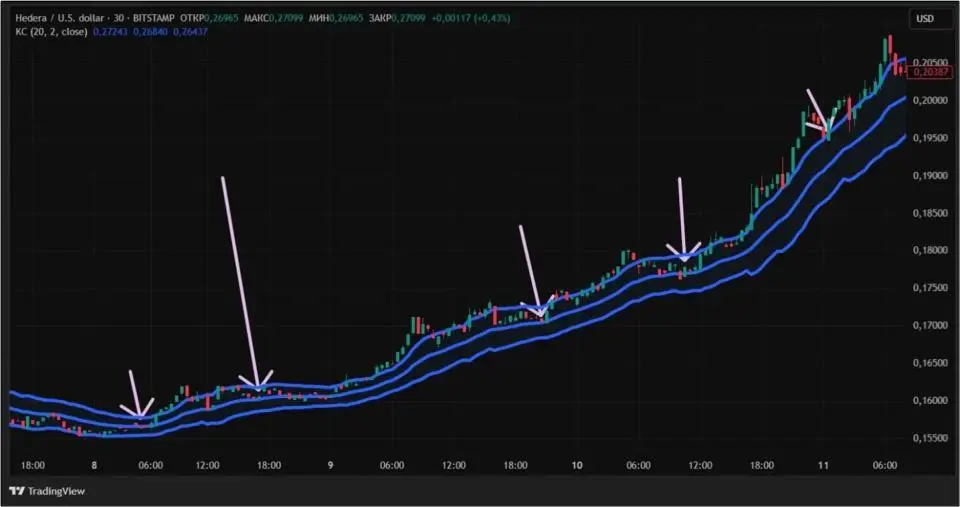
Also, in the presence of a strong trend, you can use kickbacks to the midline of the Channel Channel Keltner as the moments to increase the existing position or enter the transaction, if you have not managed to do this earlier.
For example, Hedera from July 8 to July 11 increased by more than 30%. There were at least five cases on this period of time when it was possible to enter the deal or increase the existing position. In the image below, they are marked with lilac arrows.

Source: TradingView.com
Although the above examples are quite eloquent, the Keltner channel does not show 100% efficiency. He has a number of disadvantages.
Restrictions on the channel of Keltner
Like any trading indicator, the Keltner canal is not perfect. It can give quite a lot of false signals that lead to a fairly noticeable loss. In this regard, it is worth thoroughly thinking when concluding transactions. It is better to carry out confirmation from other indicators, for example, ADX or patterns of Japanese candles: hara, bear absorption or clearance in the clouds.
It is also worth noting that the indicator appeared a long time ago, when trade still took place a little differently. There was no Internet, and transaction was carried out by transferring orders by phone. So for the trade in cryptocurrency, you will have to thoroughly sit with the settings of the Keltner channel, and not just rely on classic installations.
The creator of the indicator
Channel Keltner got its name in honor of its creator. For the first time, the indicator was described by the trader Chester William Keltner in the 1960s in the book “How to Make Money in Commodities” (how to make money for goods). It is worth noting that the channel acquired its modern name later, when it became known among the mass public. Keltner himself called his approach “the trade rule of a ten -day sliding average.”
Conclusion
Channel Keltner can help cryptoanalysts and traders in determining the direction of price movement and the correct entry point. However, it often gives a lot of inaccurate signals. In this regard, it is necessary to carefully configure it, as well as use confirmations from other indicators.
Source: Bits
I am an experienced journalist, writer, and editor with a passion for finance and business news. I have been working in the journalism field for over 6 years, covering a variety of topics from finance to technology. As an author at World Stock Market, I specialize in finance business-related topics.


