
- The AUD/JPY pair consolidates again below 95.00.
- The Yen is making a strong comeback.
- The Australian dollar is losing ground heading into the end of the week.
The pair AUD/JPY is down for Friday, while the Yen (JPY) receives a late offer to close the trading week.
The Australian dollar (AUD) received a bid in mid-week after Australian inflation rose more than expected, bringing the Reserve Bank of Australia (RBA) closer to further rate hikes heading into the end of the year, but bullish action for the AUD remains limited as the yen finds new strength.
Japanese inflation improved in October, with the annualized Tokyo Consumer Price Index (CPI) released early on Friday standing at 3.3% from 2.8% the previous month, largely due to rising inflation. Energy prices.
The Tokyo CPI, excluding food and energy prices, fell, albeit slightly, to 3.8%, compared to 3.9% in the previous period, which in turn was revised upwards from 3.8%.
Australian retail sales (forecast 0.3%, previous 0.2%) will be released on Monday followed by the Japanese unemployment rate (forecast 2.6%, previous 2.7%).
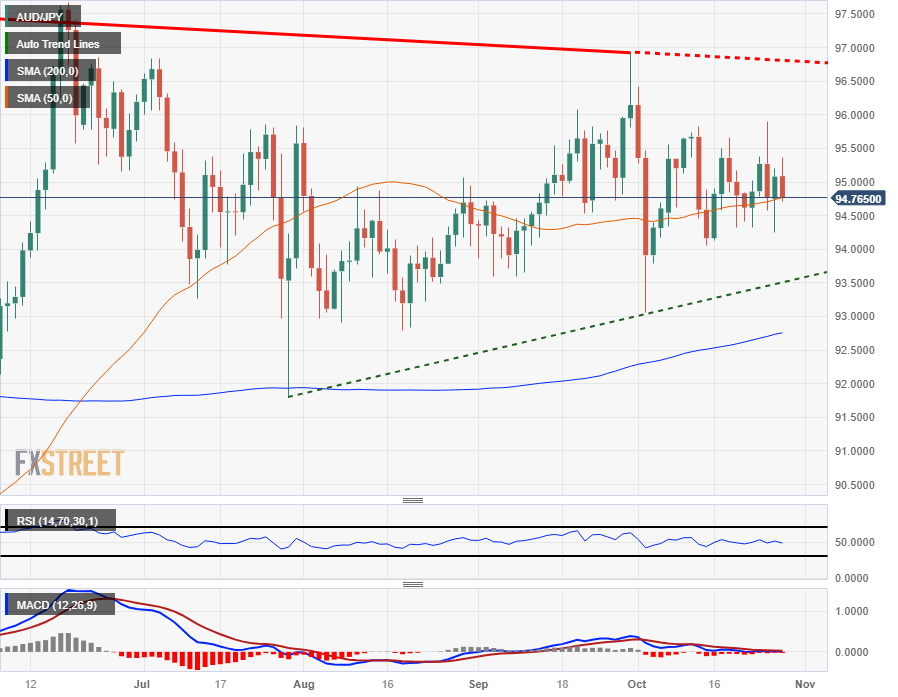
AUD/JPY Technical Outlook
Friday’s drop for the AUD sees AUD/JPY pushing directly back to the 50-day moving average (SMA) as the pair struggles to find medium-term momentum; Long-term support lies at the 200-day SMA just below 93.00, while the current ceiling of any bullish move lies at the late September high near the 97.00 area.
The Australian Dollar is still up more than 10% from 2023 lows against the Yen, but a bounce in the Yen could push AUD/JPY into a bearish trend formation.
AUD/JPY Daily Chart
AUD/JPY technical levels
Source: Fx Street
I am Joshua Winder, a senior-level journalist and editor at World Stock Market. I specialize in covering news related to the stock market and economic trends. With more than 8 years of experience in this field, I have become an expert in financial reporting.


