
- The AUD/JPY pair is currently facing minor losses, holding strong at 97.45 after hitting a low of 96.85.
- The cross suffered losses following the release of weak Australian retail sales figures for December.
- The bulls are showing resistance, but the bears are slowly gaining momentum.
In Tuesday's session, the pair AUD/JPY was seen at the 97.45 level, posting slight losses but recovering from a low of 96.85, as the AUD weakened following the release of weak retail sales figures. Bullish dominance was observed on the daily chart, with the bulls determined to hold firm. On the four-hour chart, buyers quickly recovered, reaffirming the prevailing bullish sentiment.
Weak retail sales in December underline the slow momentum in the Australian economy, but markets continue to price in just a 10% chance of a 25 basis point rate cut by the Reserve Bank of Australia (RBA) in February. Meanwhile, mixed labor market numbers in Japan, including the falling unemployment rate and the share of job seekers, give little impetus to the Bank of Japan (BoJ) to rush to pivot its monetary policy, with expectations of the market suggesting a takeoff in June.
AUD/JPY levels to watch
The daily chart indicators point to a subtle power of the bulls over the bears. The relative strength index (RSI) shows neutrality, comfortably located in the positive zone. The moving average convergence divergence (MACD) reflects this sentiment, with green bars remaining static, neither up nor down. That said, market sentiment is tilting slightly in favor of the bulls due to the positioning of the crossovers against the simple moving averages (SMA). Above the 20-day, 100-day, and 200-day SMAs, AUD/JPY is showing signs of large-scale bullish dominance.
AUD/JPY daily chart
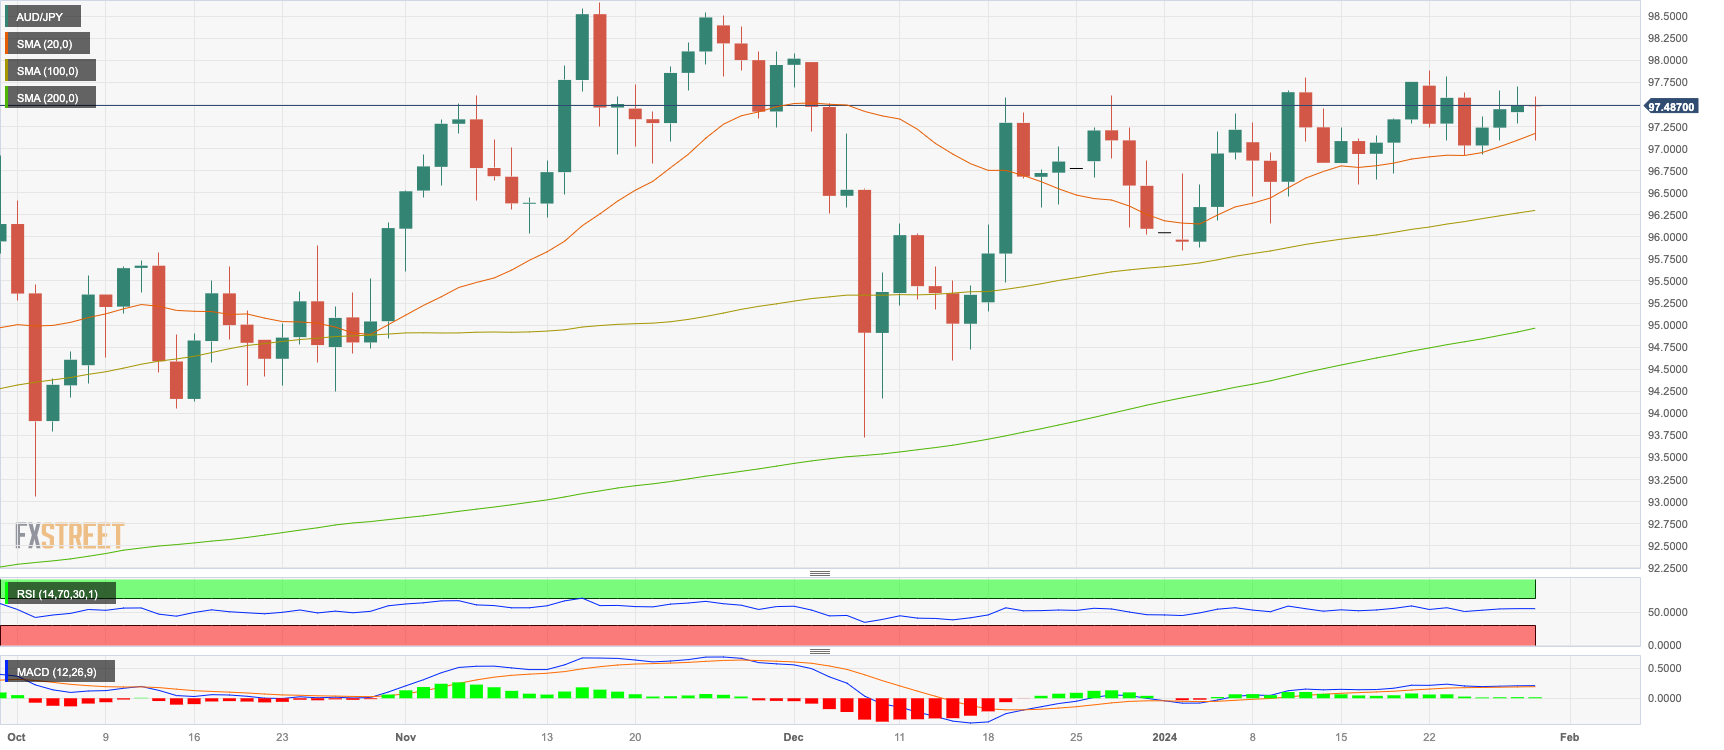
Source: Fx Street
I am Joshua Winder, a senior-level journalist and editor at World Stock Market. I specialize in covering news related to the stock market and economic trends. With more than 8 years of experience in this field, I have become an expert in financial reporting.


