
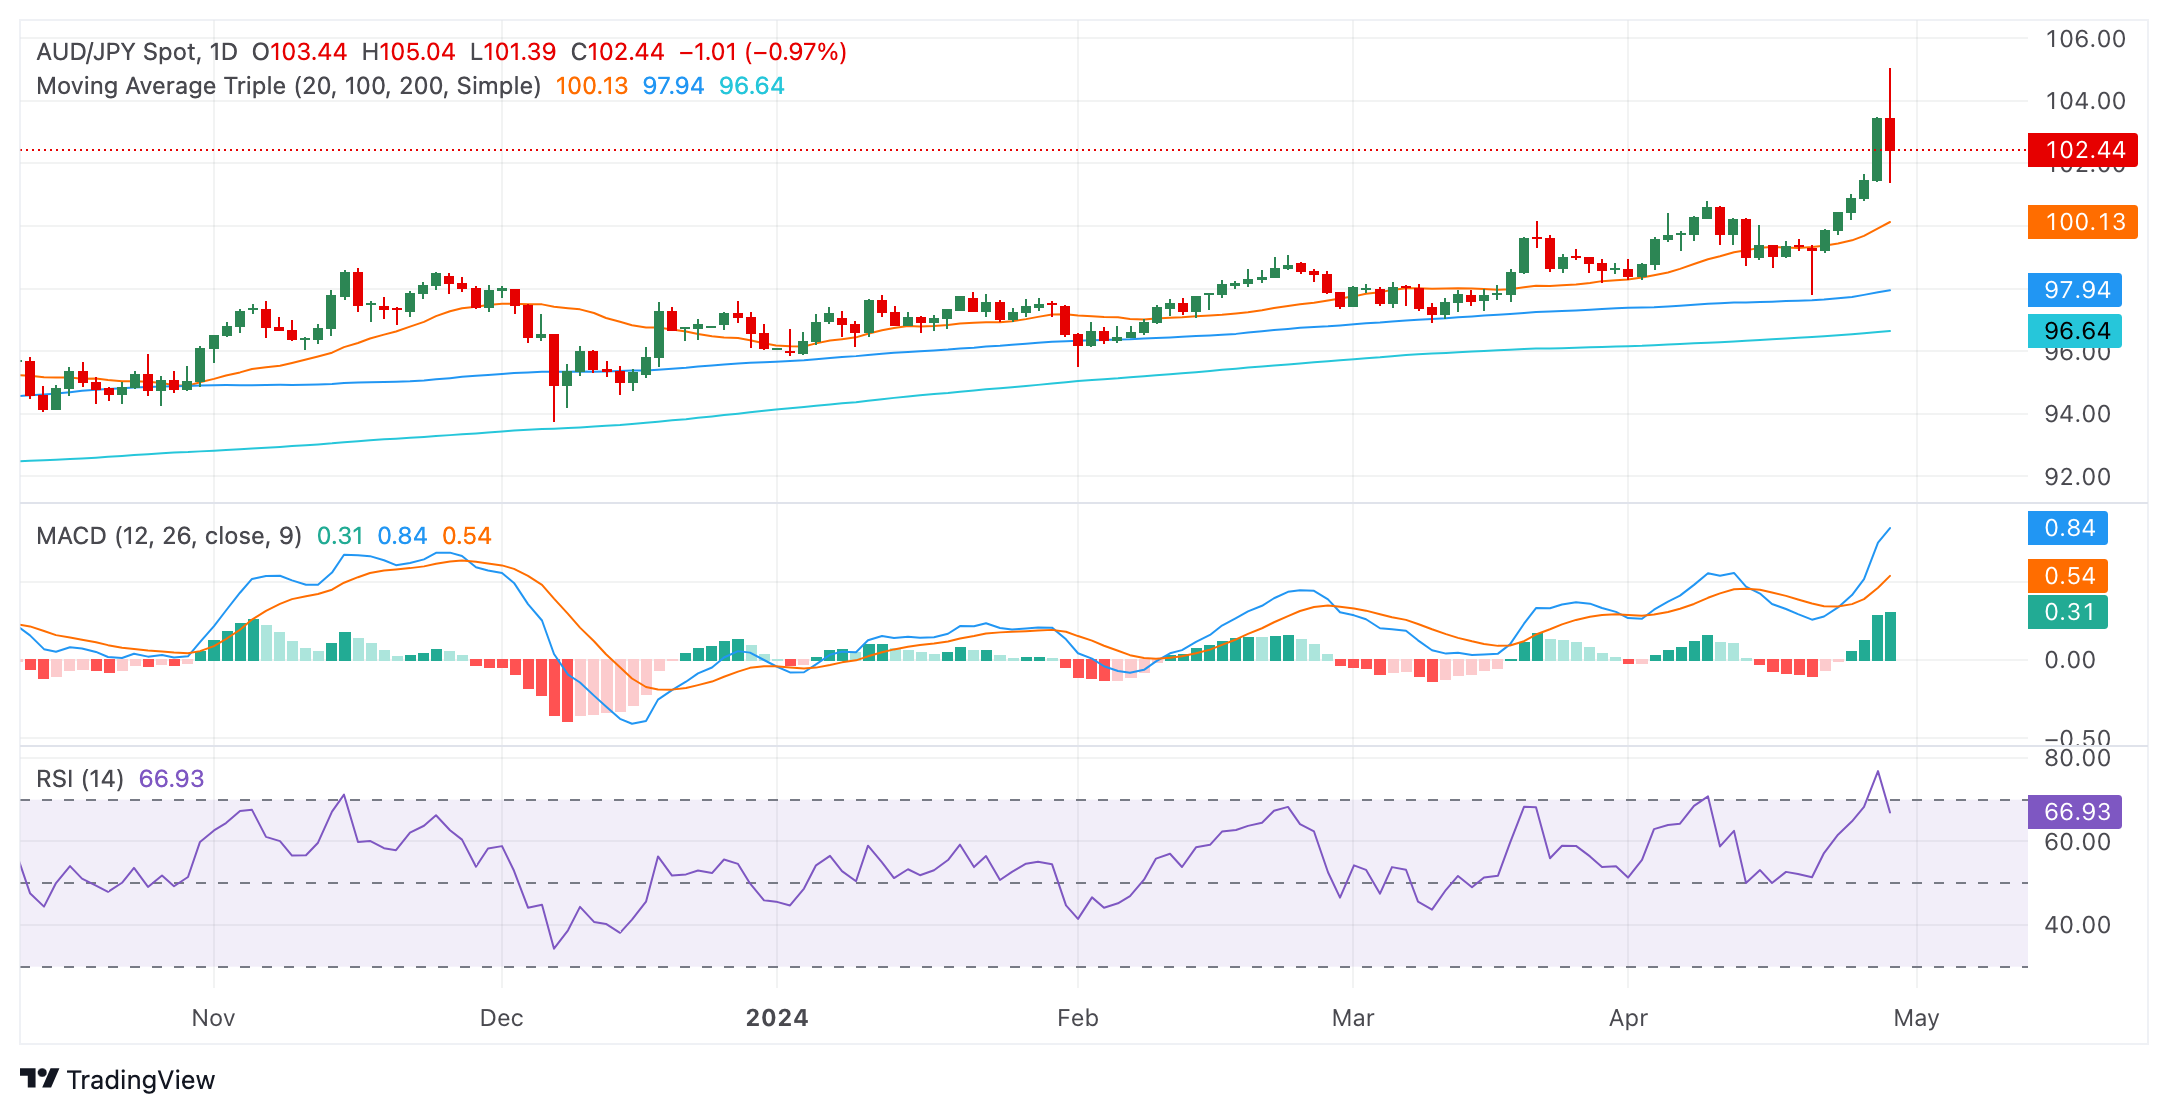
- The daily RSI suggests steady buying momentum, with a slight dip indicating the possibility of a short-term correction.
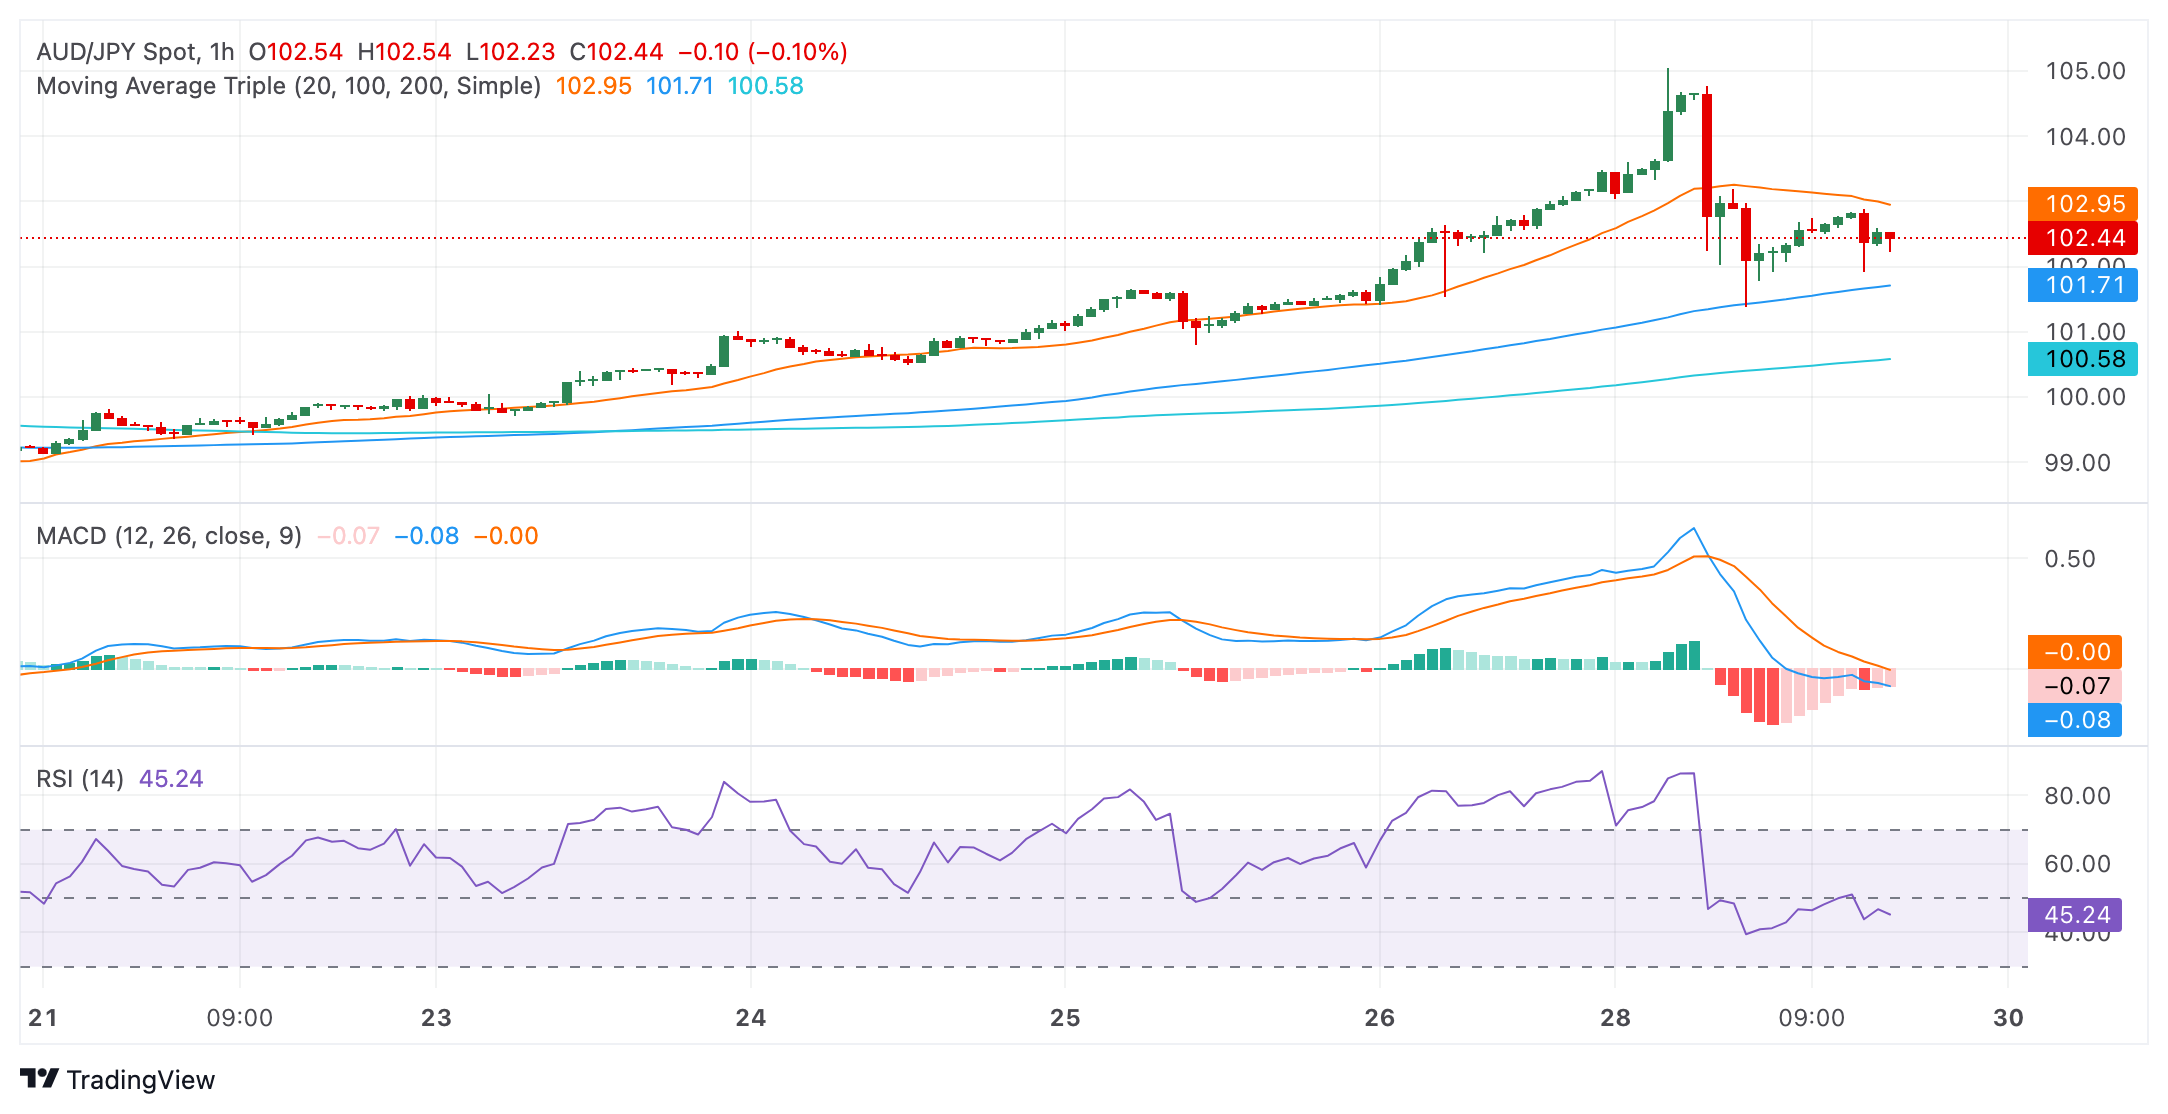
- Hourly RSI and MACD readings suggest increasing selling pressure in recent trading.
The AUD/JPY pair is trading at 102.43, demonstrating a strong bullish tilt despite Monday's heavy losses. The indicators took a sharp setback and suggest that despite the bullish order, sellers are gaining ground.
On the daily chart, the RSI is trending within overbought territory, suggesting that buying activity has dominated the market action. The recent drop from the overbought level to 66 indicates a possible short-term correction. Meanwhile, the moving average convergence divergence (MACD) is keeping the green bars flat, signifying stable positive momentum.
AUD/JPY daily chart
On the hourly chart, the RSI readings show an opposite scenario. The hourly RSI readings show a negative trend, showing that the selling activity had some control in the last few hours of trading. On the other hand, the hourly MACD is marking flat red bars, underscoring continued negative momentum.
AUD/JPY hourly chart
Looking at the broader perspective, AUD/JPY is currently positioned above the 20-day, 100-day, and 200-day SMAs. This stance underlines the prevailing bullish sentiment in the market, both in the short and long term. In conclusion, while daily indicators reflect overall bullish sentiment, recent hourly readings suggest the possibility of a short-term correction. Traders should closely monitor these opposing signals as there could be a shift in momentum in favor of sellers and they could reclaim the 20-day SMA.
Source: Fx Street
I am Joshua Winder, a senior-level journalist and editor at World Stock Market. I specialize in covering news related to the stock market and economic trends. With more than 8 years of experience in this field, I have become an expert in financial reporting.
”")


