
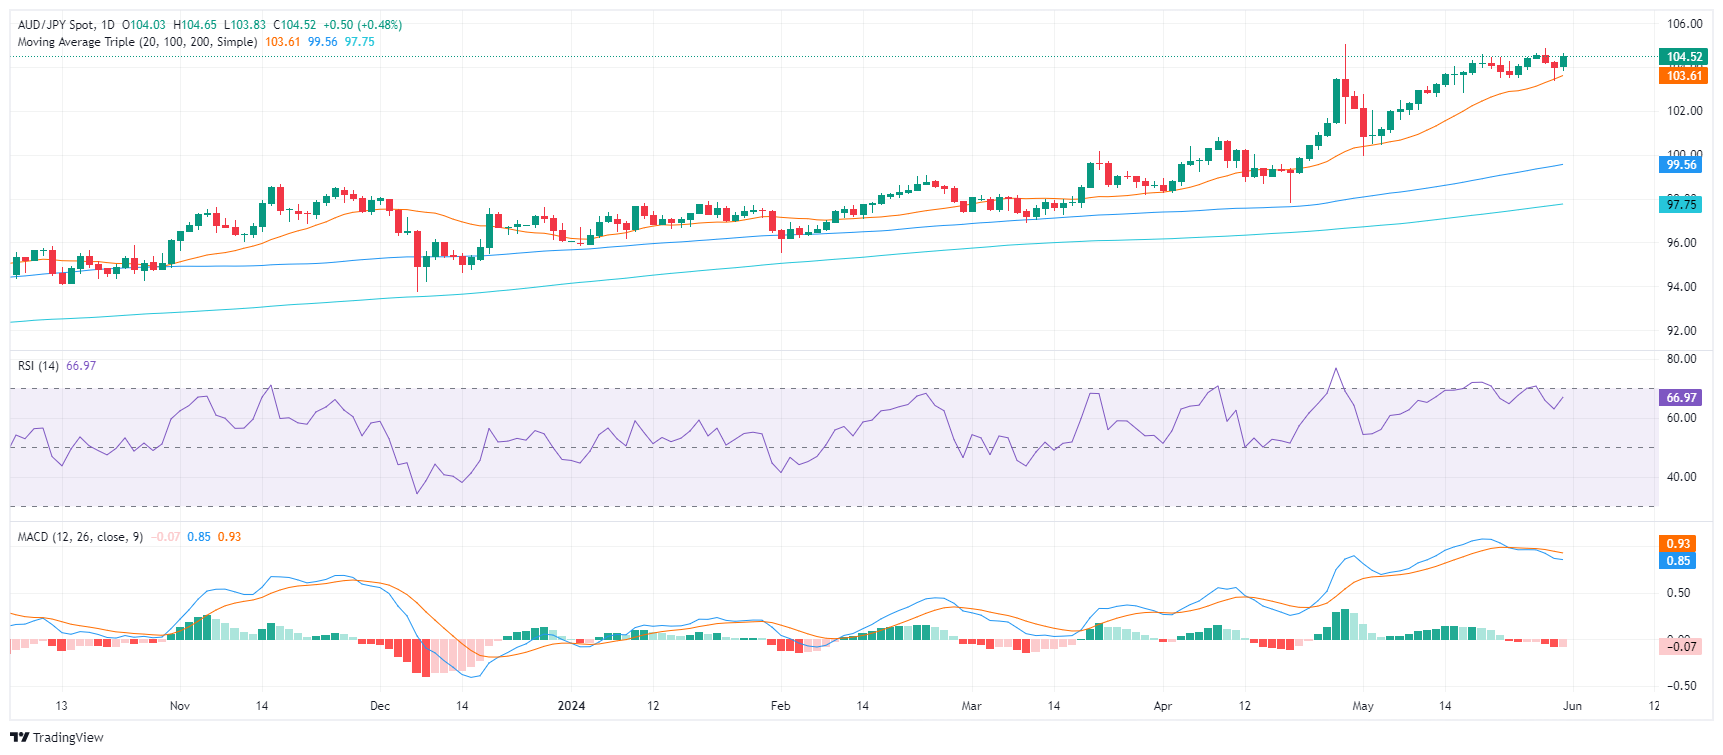
- Daily chart indicators suggest a positive tilt; the RSI rises.
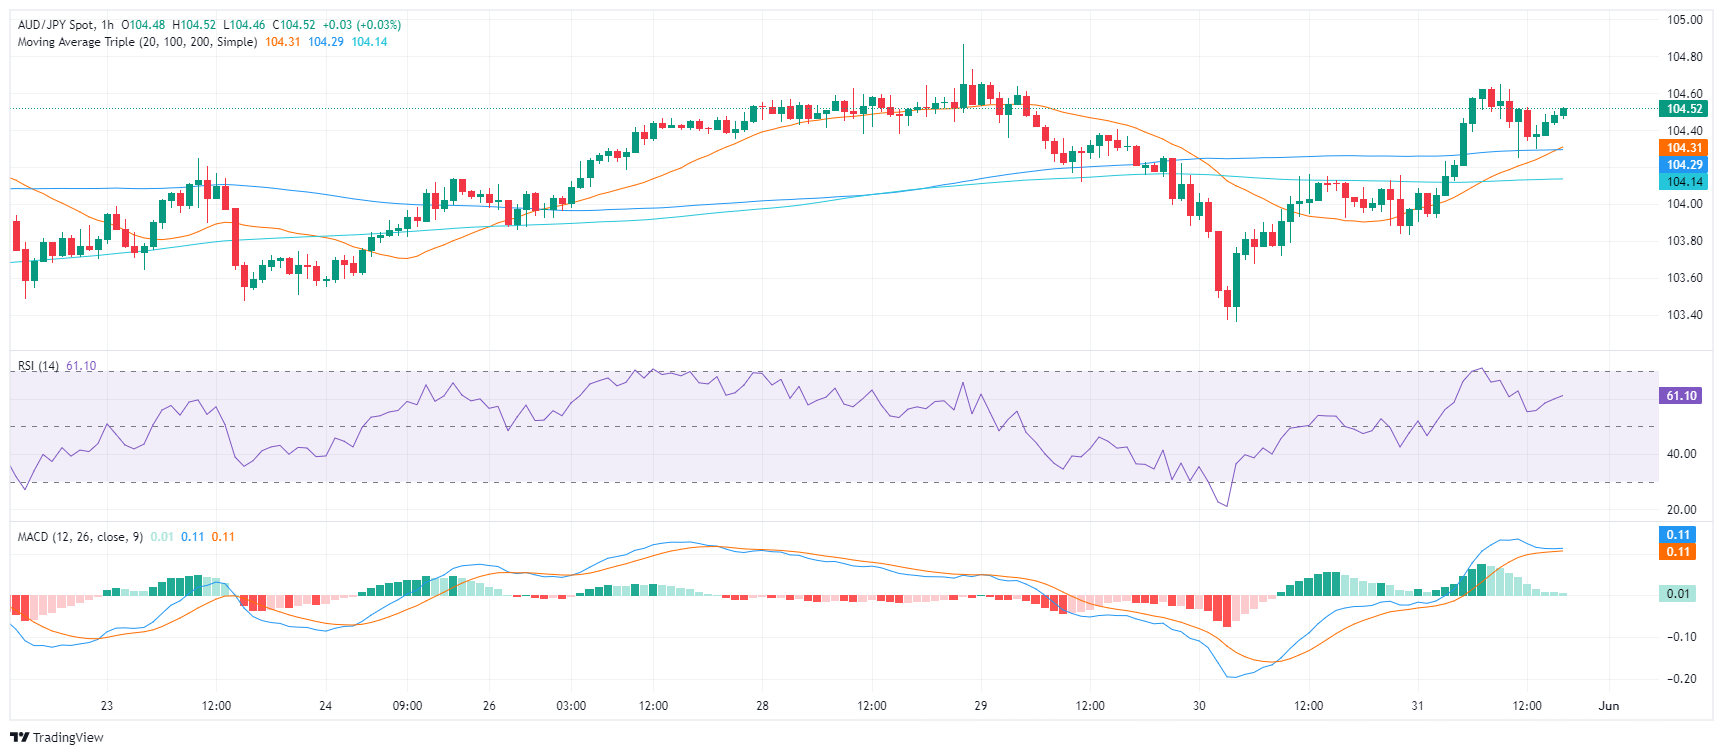
- Indicators on the hourly chart are flattening into positive territory, indicating consolidation following recent gains.
- The pair is showing signs of bullish exhaustion following recent gains, with an eye on support around the 103.60-103.80 zone.
In the trading session on Friday, the AUD/JPY pair shot up to the 104.50 region on positive momentum, reinforcing expectations of an overall bullish outlook. However, the market's upward trajectory shows signs of fatigue, and the pair has entered a consolidation phase.
On the daily chart, the RSI has risen near the 70 region, showing a slight recovery from Wednesday's drop to 67, suggesting a possible pause in the previous downtrend. Corresponding to this, the MACD creates flat red bars, indicating a possible pause in the market's selling traction.
AUD/JPY daily chart
Confirming these dynamics is the hourly chart. The RSI and MACD are greener and have flattened, indicating a possible period of consolidation after the recent rally.
AUD/JPY hourly chart
Looking back on Thursday's session, sellers were repelled at the 20-day SMA mark of 103.60 and again on Friday at 103.80. These developments have established a formidable support base in that region, which looks like it could be leveraged to stabilize recent gains. Any decline below the 20-day SMA could put the near-term bullish environment at risk.
Source: Fx Street
I am Joshua Winder, a senior-level journalist and editor at World Stock Market. I specialize in covering news related to the stock market and economic trends. With more than 8 years of experience in this field, I have become an expert in financial reporting.


