
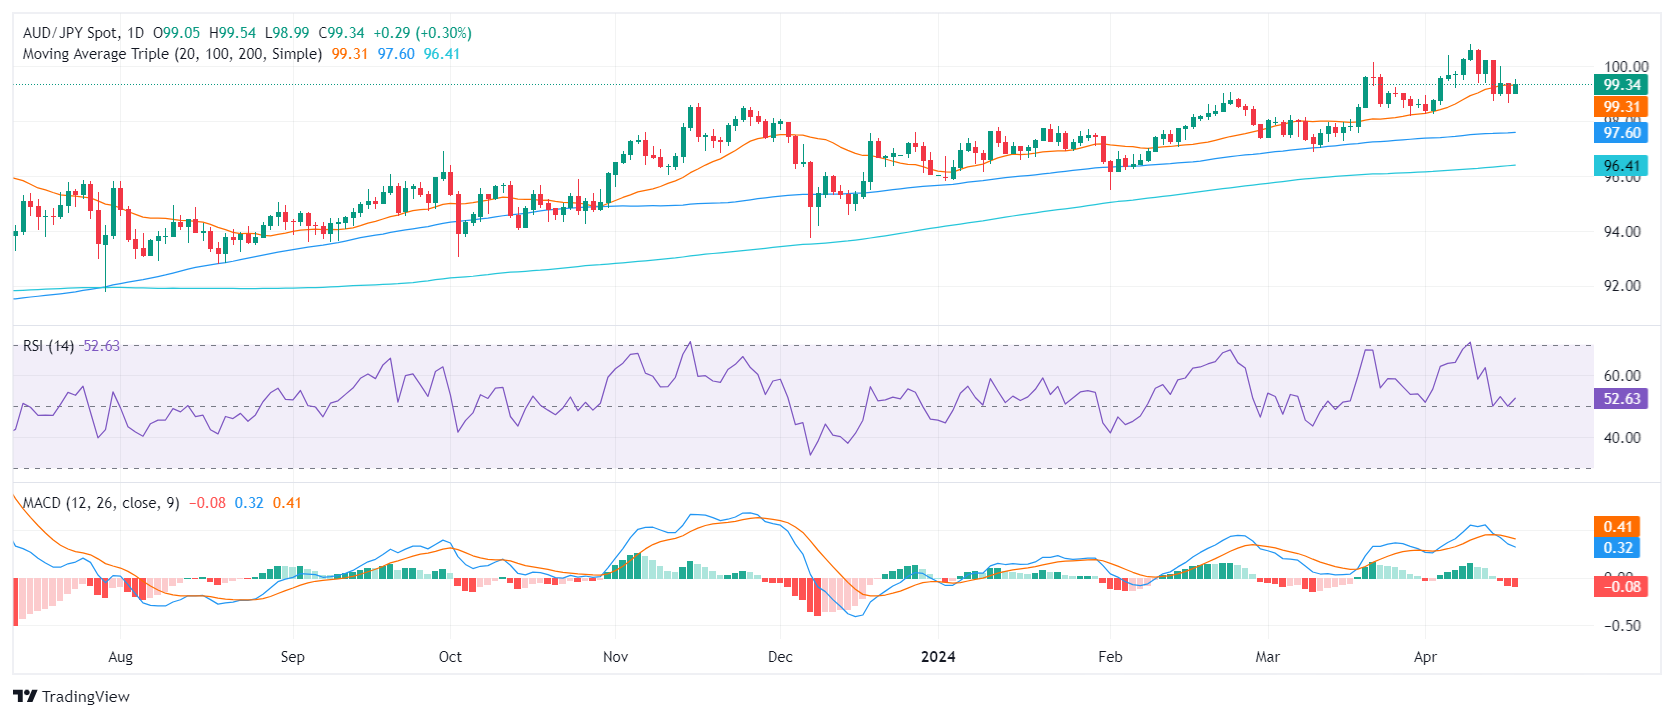
- The daily RSI for AUD/JPY shows a modest uptrend.
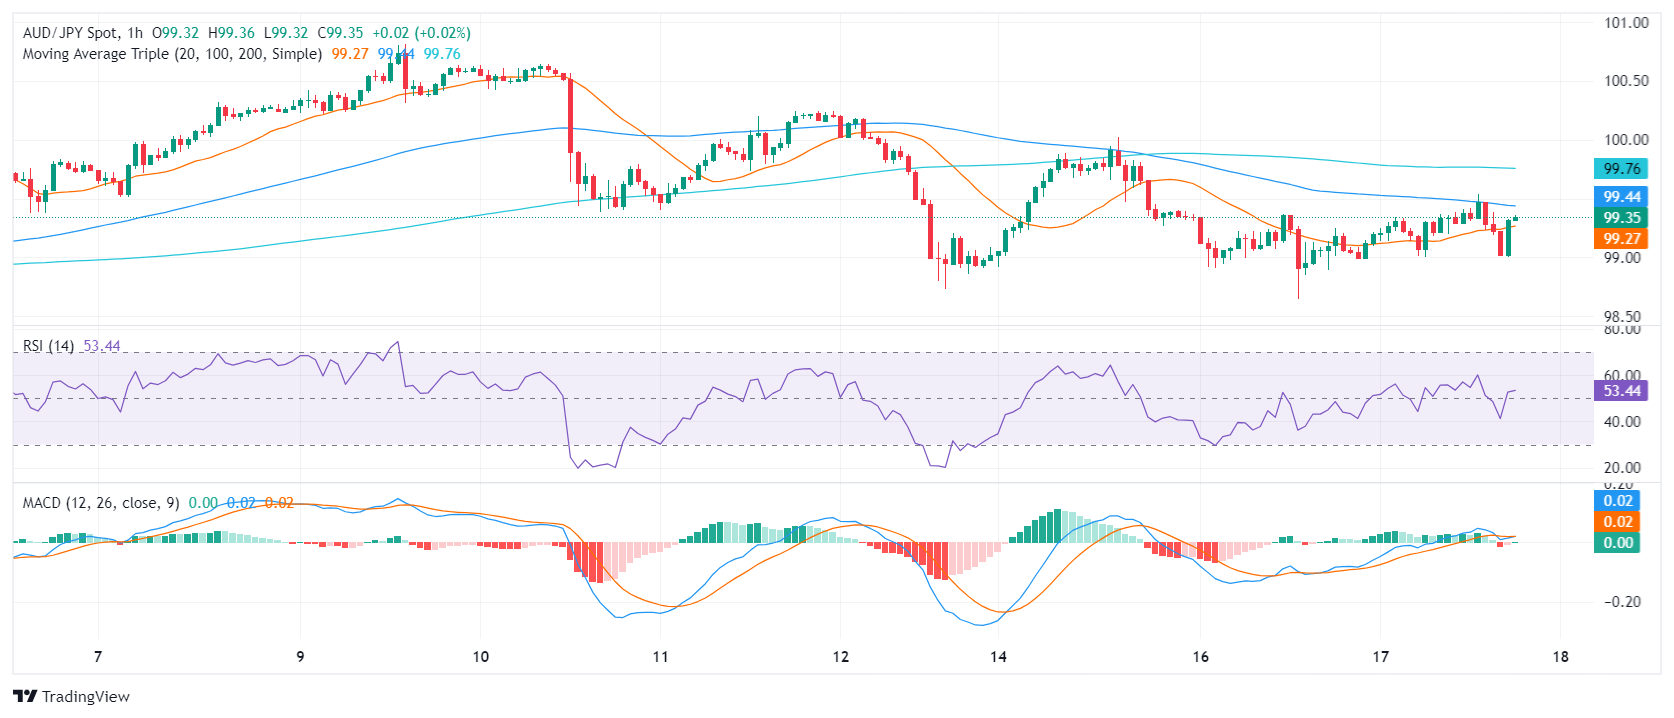
- The hourly chart shows mixed sentiment, with frequent changes in the RSI and negative momentum in the MACD bars.
- The 20-day SMA in 99.30 is the main target for the bulls.
The AUD/JPY pair showed a firmer stance as it recorded a gain of 0.27% and settled at 99.24 in Wednesday's session. Despite the recent decline, the pair indicates a dominant bullish outlook, standing firmly above the key simple moving averages (SMA). However, the recent drop below the 20-day SMA clarified the outlook for the bears in the short term.
On the daily chart, the Relative Strength Index (RSI) indicates a slight positive trend. Despite falling close to the 50 level, it recovered and maintained its position in positive territory, hovering around 52. Meanwhile, the moving average convergence divergence (MACD) shows ascending red bars, indicating a possible trend change.
AUD/JPY daily chart
The hourly RSI shows a mixed trend. The latest reading was 53, indicating a positive trend, while previous readings ranged between positive and negative territories, revealing fluctuating market momentum. The hourly MACD is showing flat red bars, signifying consistent negative momentum.
AUD/JPY hourly chart
Looking at the bigger picture, AUD/JPY's position above the 100-day and 200-day SMAs reveals a solid long-term bullish trend. Any significant move today that keeps the crossover above these levels will not threaten the positive outlook, but as the bears gain momentum, some short-term pullback should be expected.
Source: Fx Street
I am Joshua Winder, a senior-level journalist and editor at World Stock Market. I specialize in covering news related to the stock market and economic trends. With more than 8 years of experience in this field, I have become an expert in financial reporting.


