
- AUD/JPY rose 0.30%, showing bullish momentum for a possible rise beyond 102.35.
- The bullish RSI indicates room for growth before reaching overbought conditions.
- Key levels: Resistance at Tenkan-Sen (102.42) and support at Kijun-Sen (101.36).
The AUD/JPY pair extends its gains for the fifth consecutive day, rising 0.30% and trading at 102.35. Market sentiment remains optimistic, which tends to weigh on the safe-haven appeal of the Japanese Yen (JPY), which remains a laggard in currency markets against other peers.
AUD/JPY Price Analysis: Technical Outlook
After hitting a yearly high of 104.95, AUD/JPY retreated towards 100.00, following confirmed intervention from the Bank of Japan (BoJ). The pair has since extended its gains, although it faces solid resistance in the Tenkan-Sen at 102.42.
Momentum favors buyers, with the RSI in bullish territory, pointing higher with enough room before reaching overbought territory.
If AUD/JPY buyers want to retest the yearly high, they must overcome the Tenkan-Sen. Once broken, the 103.00 figure would emerge as the next stop, before testing the April 26 high at 103.47. It would then be at 104.00, followed by the yearly high.
On the other hand, if buyers fail to overcome the Tenkan-Sen, sellers could intervene and drive prices down. The first support would be 102.00, followed by Kijun-Sen at 101.36. Additional losses are seen at the May 3 low at 100.45, followed by the 100.00 figure.
AUD/JPY Price Action – Daily Chart
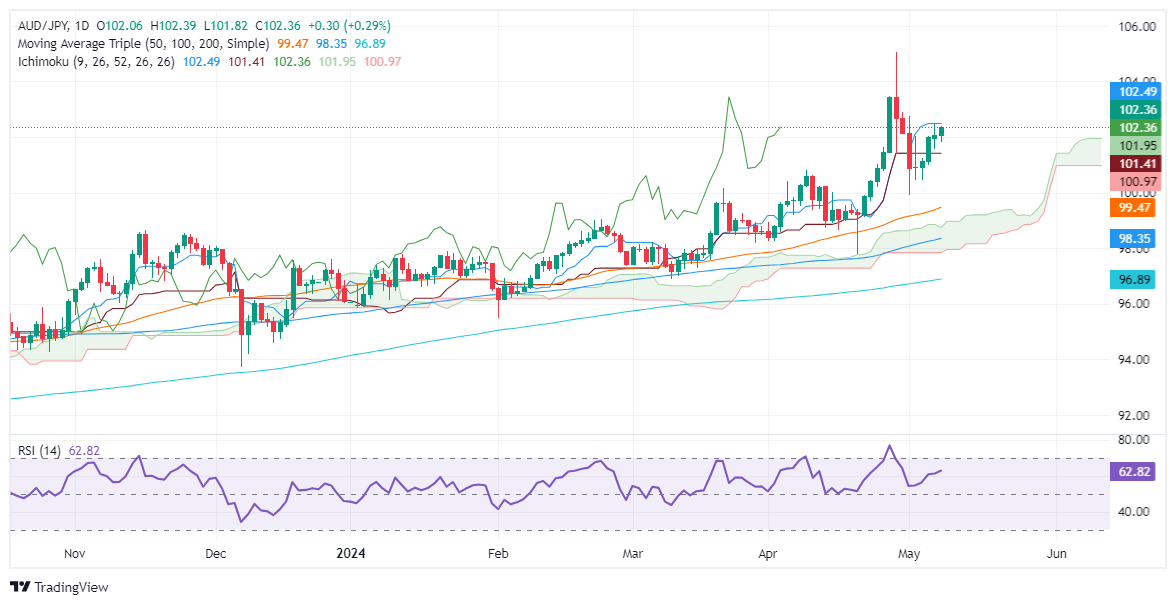
Source: Fx Street
I am Joshua Winder, a senior-level journalist and editor at World Stock Market. I specialize in covering news related to the stock market and economic trends. With more than 8 years of experience in this field, I have become an expert in financial reporting.


 marriage of Tom Cruise and Mimi Rogers has left his mark on both: Scientology, age difference and a controversial interview after the divorce")
