
- AUD/JPY falls towards 105.00, significantly below the 20-day SMA.
- The downtrend continues, now showing sharp momentum as bearish sentiment increases.
- With intensified bearish momentum, the pair could see a slight upward correction.
In Wednesday’s session, the AUD/JPY pair recorded a significant drop to 105.05, marking a five-day losing streak dating back to last week. This drop is a significant decline from Tuesday’s close of 106.80, indicating increasing bearish momentum for the pair. This continued downtrend, which is marked by indicators deep in negative territory, suggests that the pair could see further losses in the near term, but a correction is also on the table.
The daily RSI for AUD/JPY now stands at 40 as the pair has reached new lows since mid-June. Simultaneously, the daily MACD is displaying rising red bars, implying intensified selling activity.
AUD/JPY daily chart
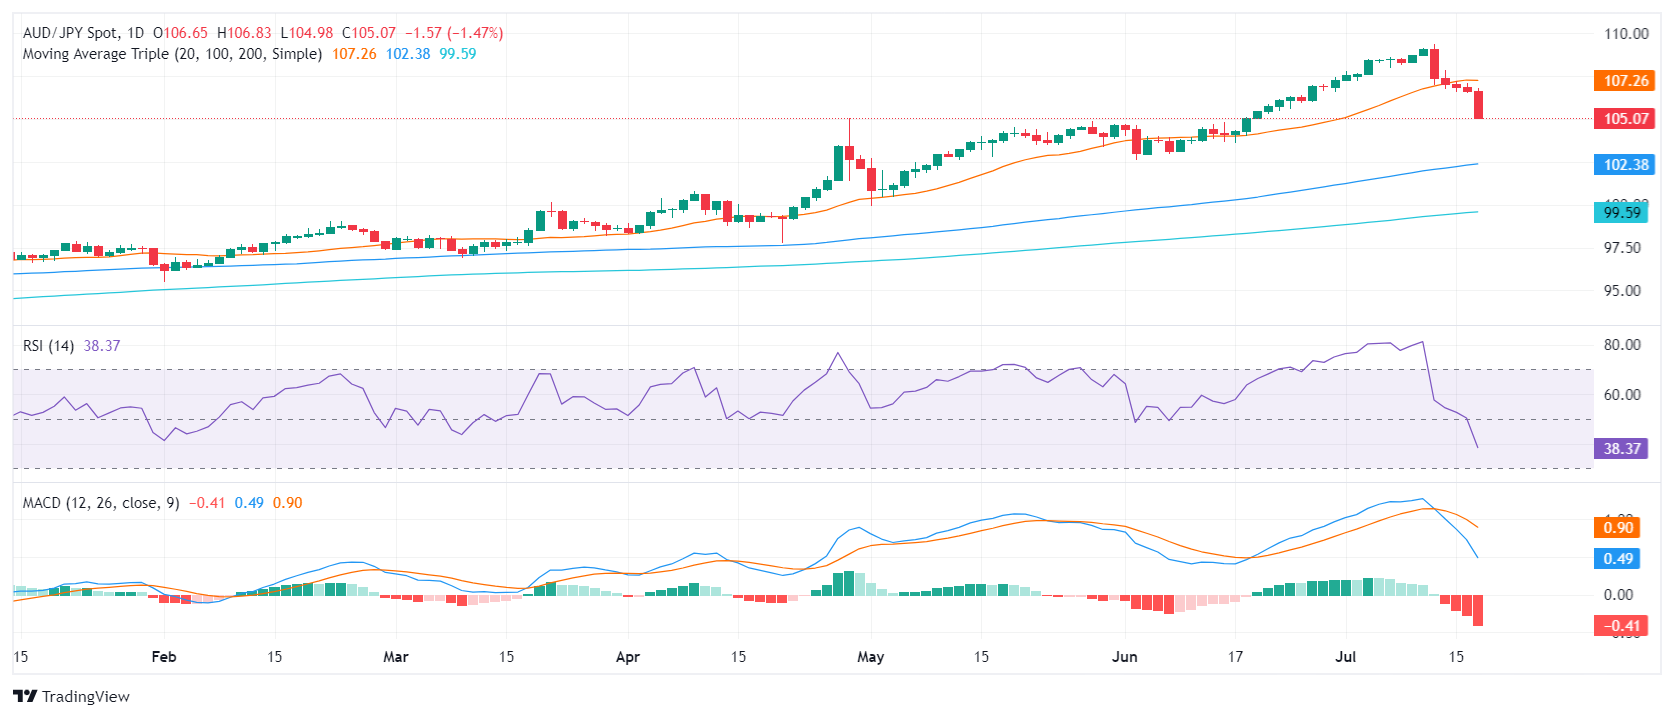 In the broader picture, the AUD/JPY pair seems to maintain its bearish bias, which is further highlighted by its position notably below the 20-day Simple Moving Average (SMA) supports. As the pair continues its decline, the immediate support levels at 105.00 and 104.30 become the crucial markers to watch. To avoid further potential losses, buyers should look to reclaim the 106.00 level and target the resurrection of the 106.50 level.
Source: Fx Street
I am Joshua Winder, a senior-level journalist and editor at World Stock Market. I specialize in covering news related to the stock market and economic trends. With more than 8 years of experience in this field, I have become an expert in financial reporting.


