
- AUD/JPY rises strongly, approaching the key psychological level of 100.00, driven by renewed optimism in global markets.
- Technical analysis highlights potential resistance at the year-to-date high of 100.81, with additional targets at 101.00.
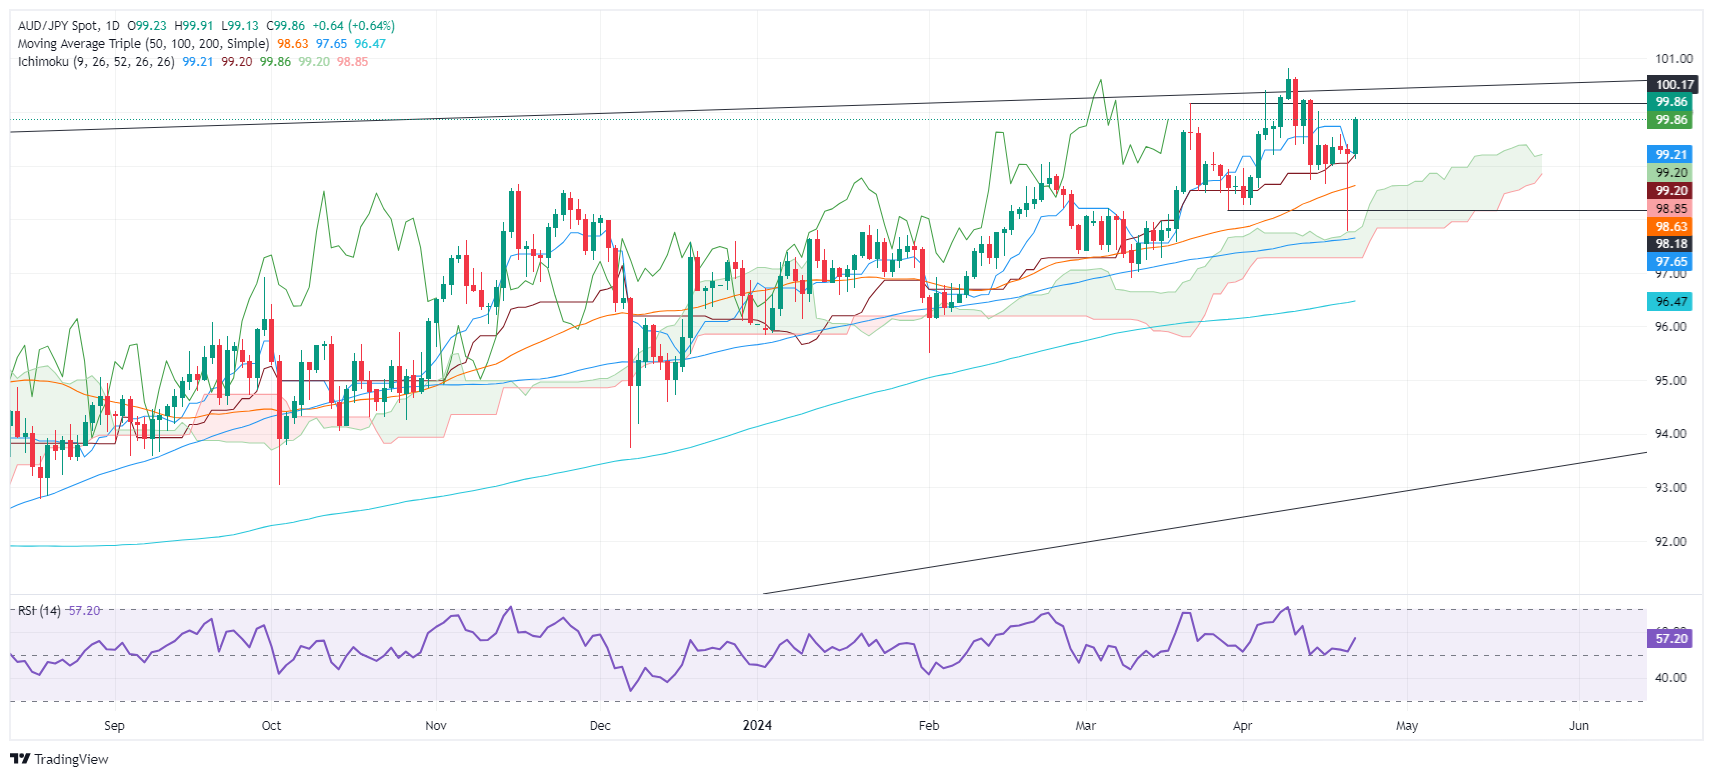
- Key support levels are identified at 99.65 and 99.20, with a potential downside risk to the March 28 low at 98.17.
AUD/JPY rallies strongly amid risk-off momentum as Wall Street resumes its rally amid a light economic agenda. At the time of writing, the pair is trading at 99.87 and posting gains of over 0.60%.
AUD/JPY Price Analysis: Technical Outlook
AUD/JPY witnessed a “hammer” formation on Friday on the daily chart, suggesting more upside is in sight. However, the pair plunged sharply towards a one-month low of 97.78 last Friday on geopolitical risks. As tensions eased, the Australian Dollar (AUD) gained ground against the Japanese Yen (JPY).
If AUD/JPY continues to advance towards 100.00, it could test the current yearly high at 100.81. Once this level is broken, the next significant resistance would be at 101.00, which would provide clear targets for traders to consider.
On the other hand, the first support for AUD/JPY would be the 61.8% Fibo retracement at 99.65. Once broken, the pair could fall towards the confluence of the Tenkan-Sen and Senkou Span A at 99.20, followed by the 99.00 mark. Once surpassed, the next stop would be at 101.00. Once surpassed, the next stop would be the March 28 low at 98.17.
AUD/JPY Price Action – Daily Chart
Source: Fx Street
I am Joshua Winder, a senior-level journalist and editor at World Stock Market. I specialize in covering news related to the stock market and economic trends. With more than 8 years of experience in this field, I have become an expert in financial reporting.


