
- The Aud/JPY falls to 93.99 after fading the strong rebound on Monday in the midst of growing geopolitical risks.
- The RSI becomes neutral, indicating consolidation near the key level of 94.00 before the Fed meeting.
- Risks arise if the price breaks below the Ichimoku support range of 93.56–93.60.
The Aud/JPY invested its course on Tuesday after registering solid profits on Monday of more than 0.98% in the midst of an improvement in the mood of market participants despite the growing tensions in the Israel-Iran conflict. However, reality hit markets, while a possible involvement of the United States (USA) in the conflict changed the feeling to negative. At the time of writing, the PAR is quoted at 93.99, practically unchanged, after registering losses of 0.37% on Tuesday.
Aud/JPY price forecast: technical perspective
From a technical point of view, the AUD/JPY seems to be prepared to consolidate at the top/lower part of the figure of 94.00. The relative force index (RSI) remains bullish, although it is approaching its neutral line, indicating indecision among traders.
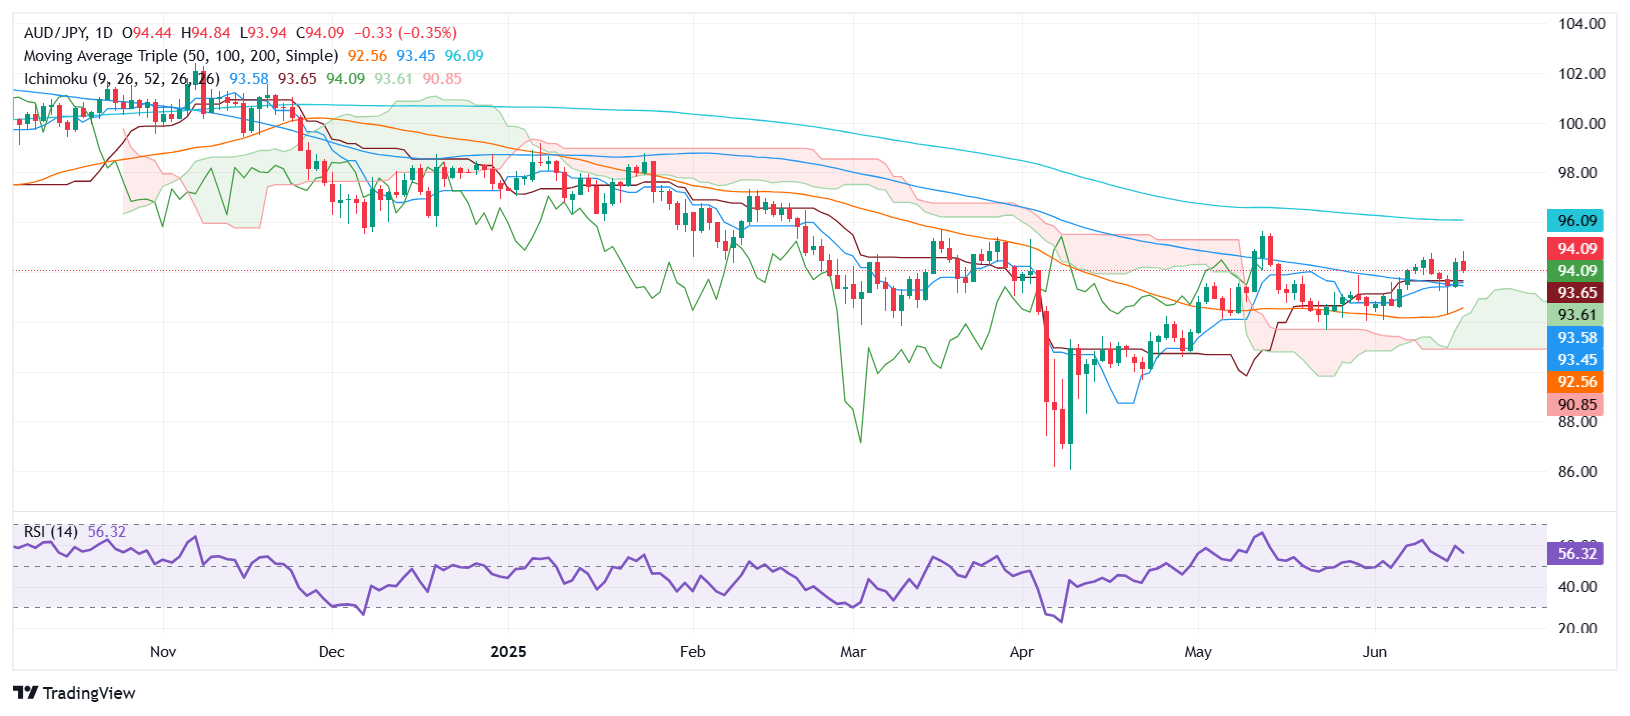
If the RSI resumes its upward trend and the aud/JPY rises above 94.50, this could pave the way for a bullish reaction. The next key resistance level would be the maximum of June 17 at 94.83, followed by the figure of 95.00. Reach this last will expose the peak of April 2 at 95.30, before the monthly maximum of February 97.32.
On the contrary, if the AUD/JPY falls below 94.00 and exceeds the confluence of Tenkan and Kijun-Sen, and Senkou Span to around 93.60/93.56, look for a fall towards the minimum daily of June 16, 93.24, before 93.00.
AUD/JPY – DIARY PRICE GRAPH
Australian dollar price this week
The lower table shows the rate of change of the Australian dollar (AUD) compared to the main currencies this week. Australian dollar was the strongest currency against the Japanese yen.
| USD | EUR | GBP | JPY | CAD | Aud | NZD | CHF | |
|---|---|---|---|---|---|---|---|---|
| USD | 0.49% | 0.99% | 0.52% | 0.67% | 0.08% | 0.02% | 0.54% | |
| EUR | -0.49% | 0.38% | 0.00% | 0.18% | -0.28% | -0.44% | 0.05% | |
| GBP | -0.99% | -0.38% | -0.35% | -0.19% | -0.66% | -0.84% | -0.33% | |
| JPY | -0.52% | 0.00% | 0.35% | 0.17% | -0.72% | -0.80% | -0.39% | |
| CAD | -0.67% | -0.18% | 0.19% | -0.17% | -0.52% | -0.65% | -0.14% | |
| Aud | -0.08% | 0.28% | 0.66% | 0.72% | 0.52% | -0.18% | 0.34% | |
| NZD | -0.02% | 0.44% | 0.84% | 0.80% | 0.65% | 0.18% | 0.52% | |
| CHF | -0.54% | -0.05% | 0.33% | 0.39% | 0.14% | -0.34% | -0.52% |
The heat map shows the percentage changes of the main currencies. The base currency is selected from the left column, while the contribution currency is selected in the upper row. For example, if you choose the Australian dollar of the left column and move along the horizontal line to the US dollar, the percentage change shown in the box will represent the Aud (base)/USD (quotation).
Source: Fx Street
I am Joshua Winder, a senior-level journalist and editor at World Stock Market. I specialize in covering news related to the stock market and economic trends. With more than 8 years of experience in this field, I have become an expert in financial reporting.


