
- AUD/JPY gains ground due to a possible momentum shift from bearish to bullish.
- Bullish sentiment is possible if the RSI rises above the 50 mark.
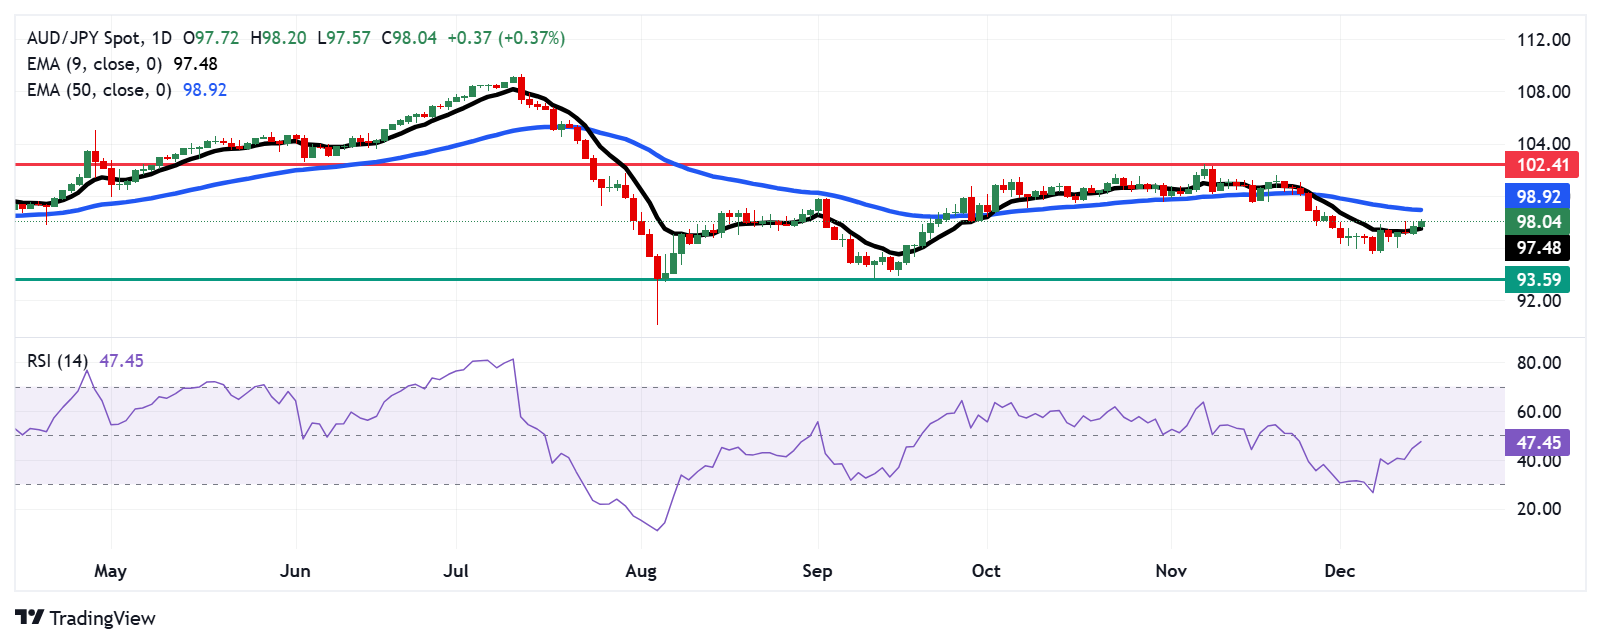
- Initial support appears at the psychological level of 98.00, followed by the nine-day EMA at 97.50.
The AUD/JPY cross extends its gains for the second day in a row, trading around 98.20 during Asian hours on Monday. The 14-day Relative Strength Index (RSI) is positioned slightly below the 50 level, indicating that bearish momentum is still in play. If the RSI rises above 50, it would signal the emergence of a bullish bias.
Furthermore, a review of the daily chart indicates that the nine-day exponential moving average (EMA) remains below the 50-day EMA. This alignment suggests that short-term price momentum is weaker compared to the long-term trend, signaling the potential for continued price weakness.
Initial support for the AUD/JPY cross lies at the psychological level of 98.00, followed by the nine-day EMA at 97.50. A decisive break below this level could open the doors for the currency cross to navigate the region around its four-month low of 93.59, recorded on September 11.
To the upside, the AUD/JPY cross could test its main resistance near the 50-day EMA at the 98.92 level. A decisive break above this level would signal a strengthening of bullish momentum, potentially taking the pair towards the five-month high of 102.41, last reached on November 7.
AUD/JPY: Daily chart
Australian Dollar PRICE Today
The table below shows the percentage change of the Australian Dollar (AUD) against major currencies today. Australian dollar was the strongest currency against the Japanese yen.
| USD | EUR | GBP | JPY | CAD | AUD | NZD | CHF | |
|---|---|---|---|---|---|---|---|---|
| USD | -0.16% | -0.15% | 0.08% | -0.07% | -0.25% | -0.27% | -0.26% | |
| EUR | 0.16% | 0.06% | 0.34% | 0.15% | 0.07% | -0.07% | -0.06% | |
| GBP | 0.15% | -0.06% | 0.16% | 0.09% | 0.01% | -0.13% | -0.12% | |
| JPY | -0.08% | -0.34% | -0.16% | -0.15% | -0.32% | -0.33% | -0.27% | |
| CAD | 0.07% | -0.15% | -0.09% | 0.15% | -0.13% | -0.21% | -0.21% | |
| AUD | 0.25% | -0.07% | -0.01% | 0.32% | 0.13% | -0.12% | -0.14% | |
| NZD | 0.27% | 0.07% | 0.13% | 0.33% | 0.21% | 0.12% | -0.02% | |
| CHF | 0.26% | 0.06% | 0.12% | 0.27% | 0.21% | 0.14% | 0.02% |
The heat map shows percentage changes for major currencies. The base currency is selected from the left column, while the quote currency is selected from the top row. For example, if you choose the Australian Dollar from the left column and move along the horizontal line to the US Dollar, the percentage change shown in the box will represent the AUD (base)/USD (quote).
Source: Fx Street
I am Joshua Winder, a senior-level journalist and editor at World Stock Market. I specialize in covering news related to the stock market and economic trends. With more than 8 years of experience in this field, I have become an expert in financial reporting.


")


