
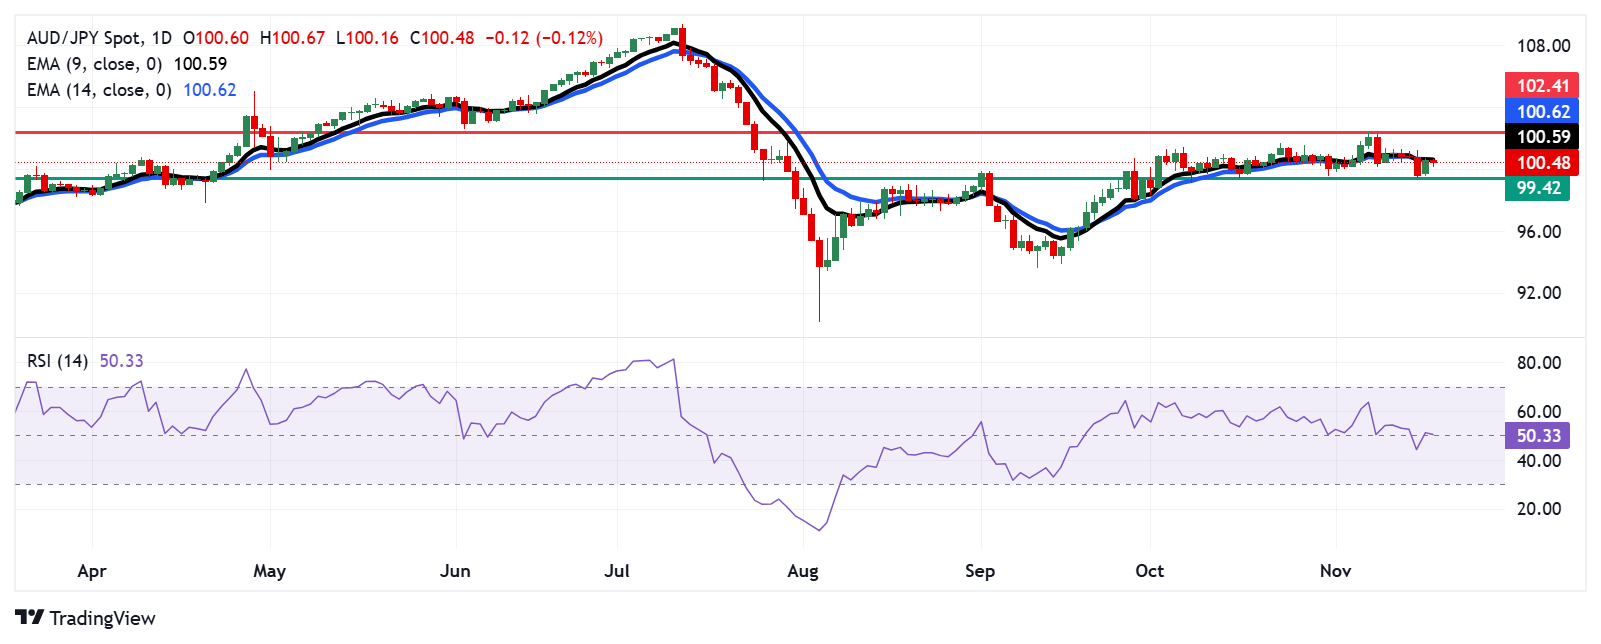
- AUD/JPY can be appreciated as the daily chart analysis indicates a possible change in price momentum from bearish to bullish.
- A bullish reversal could be possible if the nine-day EMA breaks above the 14-day EMA.
- A break above the nine-day and 14-day EMAs could cause a bullish bias to emerge.
The AUD/JPY cross remains relatively flat around 100.50 during the Asian trading session on Tuesday, following a gain of almost 1% in the previous session. An analysis of the daily chart suggests a possible shift in momentum from bearish to bullish as the pair looks to break above the nine-day exponential moving average (EMA).
Furthermore, the nine-day EMA is currently located just below the 14-day EMA. An upward crossover would signal a change in short-term price momentum from bearish to bullish as it indicates that recent prices are gaining strength and pushing higher compared to the longer-term trend.
Furthermore, the 14-day Relative Strength Index (RSI) is at the 50 level, signaling a neutral market condition. Any further movement in the AUD/JPY cross will likely determine the next clear directional trend.
To the upside, the AUD/JPY cross is testing the immediate resistance at the nine-day EMA around the 100.58 level, followed by the 100.61 level. A break above these levels could trigger a bullish bias, potentially pushing the currency cross towards the four-month high of 102.41, reached on November 7.
On the downside, the main support for the AUD/JPY cross lies around the recent low of 99.42. A break below this level would strengthen the bearish outlook and could take the cross towards the psychological support level of 99.00.
AUD/JPY: Daily chart
Australian Dollar PRICE Today
The table below shows the percentage change of the Australian Dollar (AUD) against major currencies today. Australian dollar was the weakest currency against the Japanese yen.
| USD | EUR | GBP | JPY | CAD | AUD | NZD | CHF | |
|---|---|---|---|---|---|---|---|---|
| USD | 0.07% | 0.05% | -0.09% | 0.06% | 0.04% | 0.12% | 0.05% | |
| EUR | -0.07% | -0.02% | -0.13% | -0.01% | -0.03% | 0.06% | -0.02% | |
| GBP | -0.05% | 0.02% | -0.10% | 0.01% | -0.01% | 0.08% | 0.00% | |
| JPY | 0.09% | 0.13% | 0.10% | 0.15% | 0.12% | 0.20% | 0.14% | |
| CAD | -0.06% | 0.00% | -0.01% | -0.15% | -0.02% | 0.06% | -0.02% | |
| AUD | -0.04% | 0.03% | 0.01% | -0.12% | 0.02% | 0.09% | 0.03% | |
| NZD | -0.12% | -0.06% | -0.08% | -0.20% | -0.06% | -0.09% | -0.07% | |
| CHF | -0.05% | 0.02% | -0.01% | -0.14% | 0.02% | -0.03% | 0.07% |
The heat map shows percentage changes for major currencies. The base currency is selected from the left column, while the quote currency is selected from the top row. For example, if you choose the Australian Dollar from the left column and move along the horizontal line to the US Dollar, the percentage change shown in the box will represent the AUD (base)/USD (quote).
Source: Fx Street
I am Joshua Winder, a senior-level journalist and editor at World Stock Market. I specialize in covering news related to the stock market and economic trends. With more than 8 years of experience in this field, I have become an expert in financial reporting.


