
- AUD/NZD falls to a low of 1.0815 after hitting a high of 1.0850 on Wednesday.
- Strong Australian data tempers RBA rate cut expectations, while weak New Zealand data renews RBNZ policy divergence.
- Following disappointing ANZ data, market is betting on higher odds of an RBNZ rate cut in November.
AUD/NZD was seen trading lower during the trading session on Wednesday as markets digested high-level data from both Australia and New Zealand.
In Australia, the Consumer Price Index (CPI) for April stood at 3.6% year-on-year, exceeding expectations of 3.4% and 3.5% the previous month. This marked the second consecutive month of acceleration and is the highest inflation rate since November. With core inflation remaining above 4%, there are strong signs that the Reserve Bank of Australia (RBA) could change its tone to a more hawkish one.
Meanwhile, disappointing ANZ business survey data for May became a focal point in New Zealand. The self-activity outlook index fell to a low of 11.8 from 14.3 in April, suggesting weaker growth. Recently persistent domestic inflation led the RBNZ to discuss a possible rate hike, leading to a significant strengthening of the Kiwi. Markets are betting that the first cut will come in November of this year, with a 65% probability.
AUD/NZD technical analysis
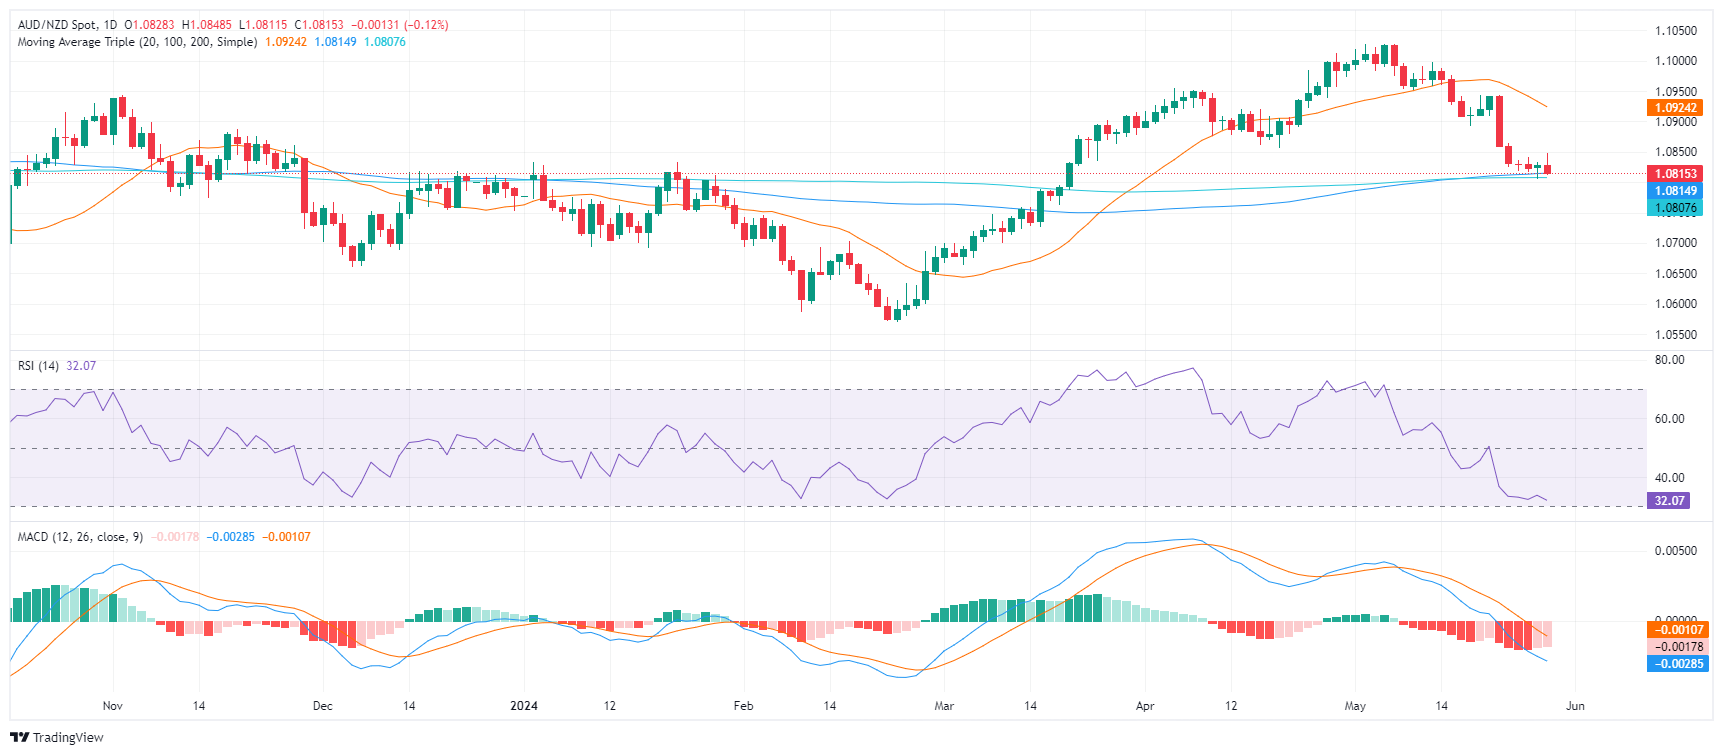
On the daily chart, the RSI remains in negative territory, indicating a strong bearish trend. This is consolidated by the rising red bars on the MACD histogram, confirming the continued downward momentum.
That being said, as the pair approaches oversold territory, the pair could see a slight upward correction in the coming sessions.
AUD/NZD Daily Chart
Source: Fx Street
I am Joshua Winder, a senior-level journalist and editor at World Stock Market. I specialize in covering news related to the stock market and economic trends. With more than 8 years of experience in this field, I have become an expert in financial reporting.


