
- The AUD/NZD pair sinks, breaking below the two-week range.
- The AUD has lost the currency toss against the NZD as traders position themselves ahead of China’s inflation numbers.
- With data set to drop over the weekend, Monday promises more action.
The pair USD/NZD is trading at two-week lows as the AUD falters against its close neighbor, the Kiwi (NZD). With both currencies exposed to the impact of data coming out of China, investors have placed the AUD as the bigger loser of the two.
China Consumer Price Index (CPI) numbers will fall over the weekend outside of market hours, and Markets could be positioning ahead, sending the Aussie out of the recent consolidation range in anticipation.
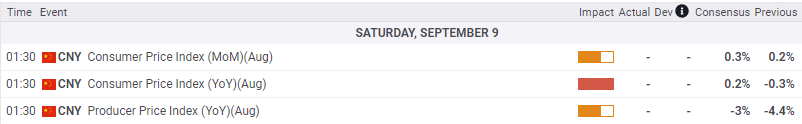
China CPI heading lower
China’s inflation numbers are expected to pick up slightly to 0.2% yoy from a previous contraction of -0.3%. The lack of price growth in the Chinese economy would be a continuation of the sign of economic weakness in the Asian region, and greater selling pressure could drive down the Australian dollar even further next week.
China data calendar; hours in GMT
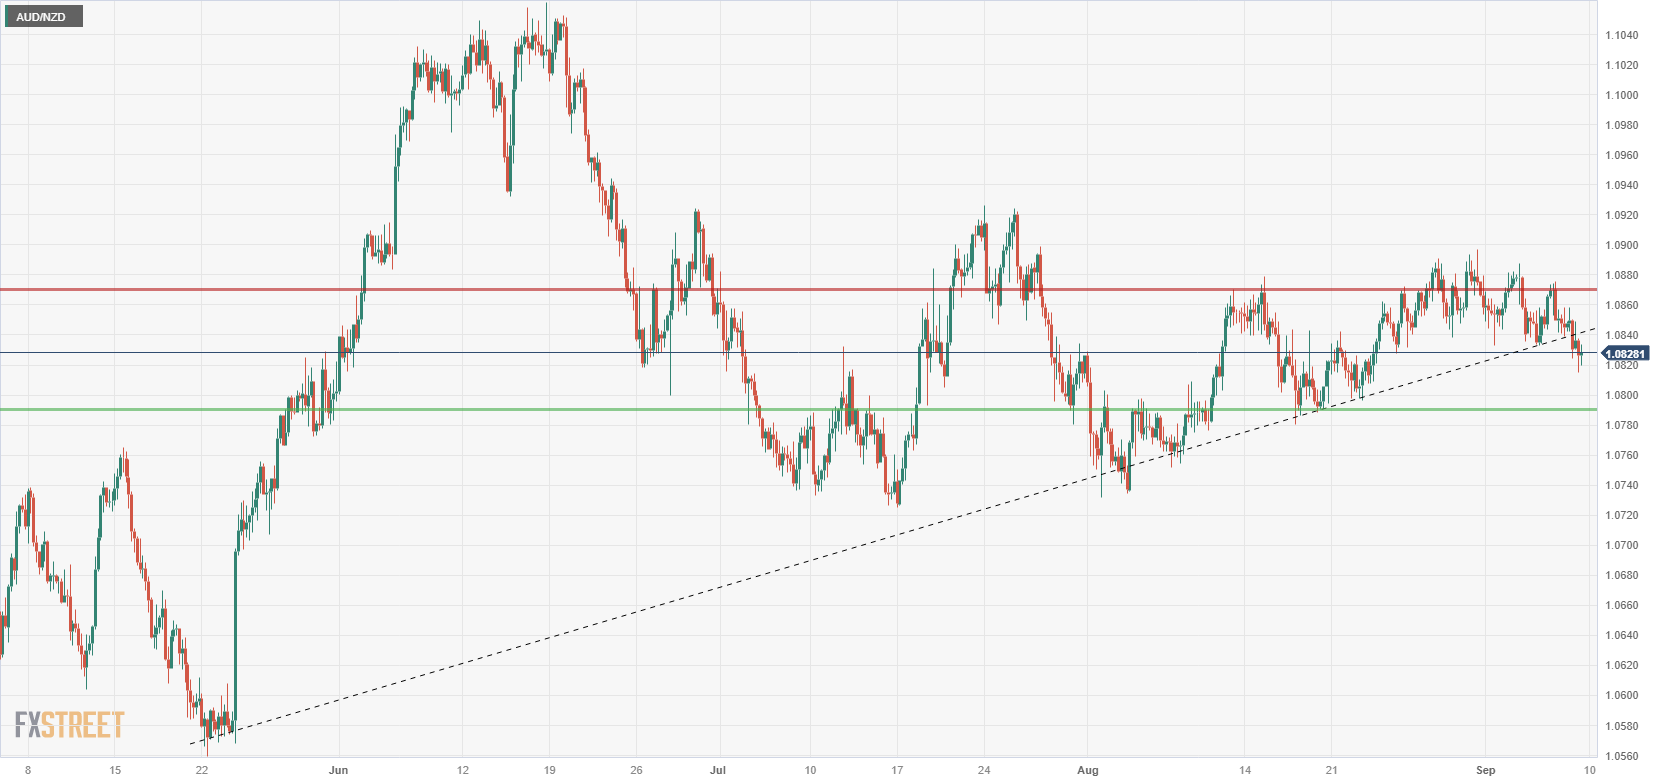
AUD/NZD Technical Outlook
The AUD/NZD pair has entered two-week lows, touching 1.0820 heading into the end of the week. With the cross stuck in a consolidation range between 1.0740 and 1.0940 for the past few months, a breakout was almost inevitable, and 1.0760 to 1.0740 will be the short-term support range.
On the bullish side, a break to the upside with improving market sentiment will see AUD/NZD challenge the strong resistance at 1.0880 before it can advance further from there.
AUD/NZD 4-hour chart
Technical levels
Source: Fx Street
I am Joshua Winder, a senior-level journalist and editor at World Stock Market. I specialize in covering news related to the stock market and economic trends. With more than 8 years of experience in this field, I have become an expert in financial reporting.


