
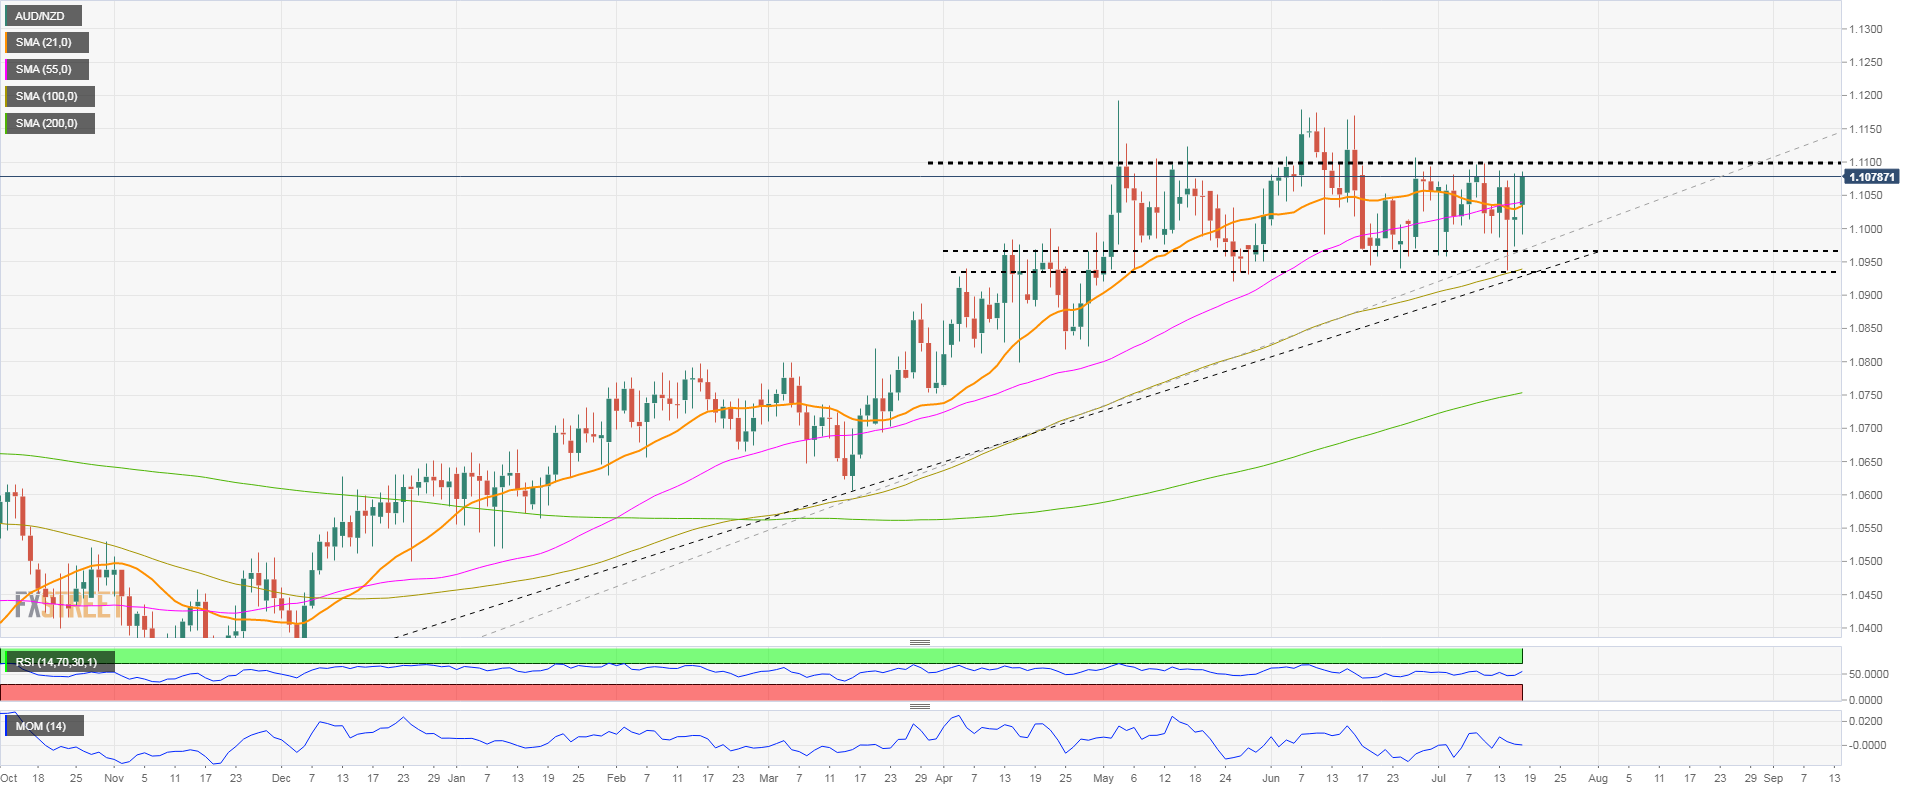
- AUD/NZD continues to move sideways around the 20 and 55 day SMA.
- The medium-term bullish rally faces resistance at 1.1100.
- Next event: The RBA meeting on Tuesday.
The crossing AUD/NZD still moving sideways below 1.1100. The 1.1100 area limits the upside. A break to the upside should strengthen the aussie, targeting 1.1150 initially and then a test of 1.1180.
The 20 and 55 day simple moving averages are sideways close to the current price, reflecting how the cross has traded over the last thirty days. Technical indicators offer no clear signals, also affected by recent price action.
On the other hand, a consolidation below 1.1000 should expose an uptrend line at 1.0970. A break down would open the door for more losses, initially to 1.0950 (20-week SMA). A confirmation below 1.0920 would be a stronger bearish signal, targeting 1.0800.
While between the uptrend line and the 1.1100 zone, volatility in AUD/NZD is likely to remain limited. On Tuesday, the Reserve Bank of Australia will announce its decision on monetary policy, an event that could trigger sharp moves in AUD crosses.
AUD/NZD daily chart
Technical levels
Source: Fx Street
With 6 years of experience, I bring to the table captivating and informative writing in the world news category. My expertise covers a range of industries, including tourism, technology, forex and stocks. From brief social media posts to in-depth articles, I am dedicated to creating compelling content for various platforms.


