
- AUD/NZD has confirmed a bearish reversal pattern after peaking in late November.
- The MACD has crossed below its signal line providing a sell signal.
AUD/NZD has completed a Three Black Crows candlestick pattern (red rectangle on chart) after reaching a multi-month high on November 25.
AUD/NZD Daily Chart
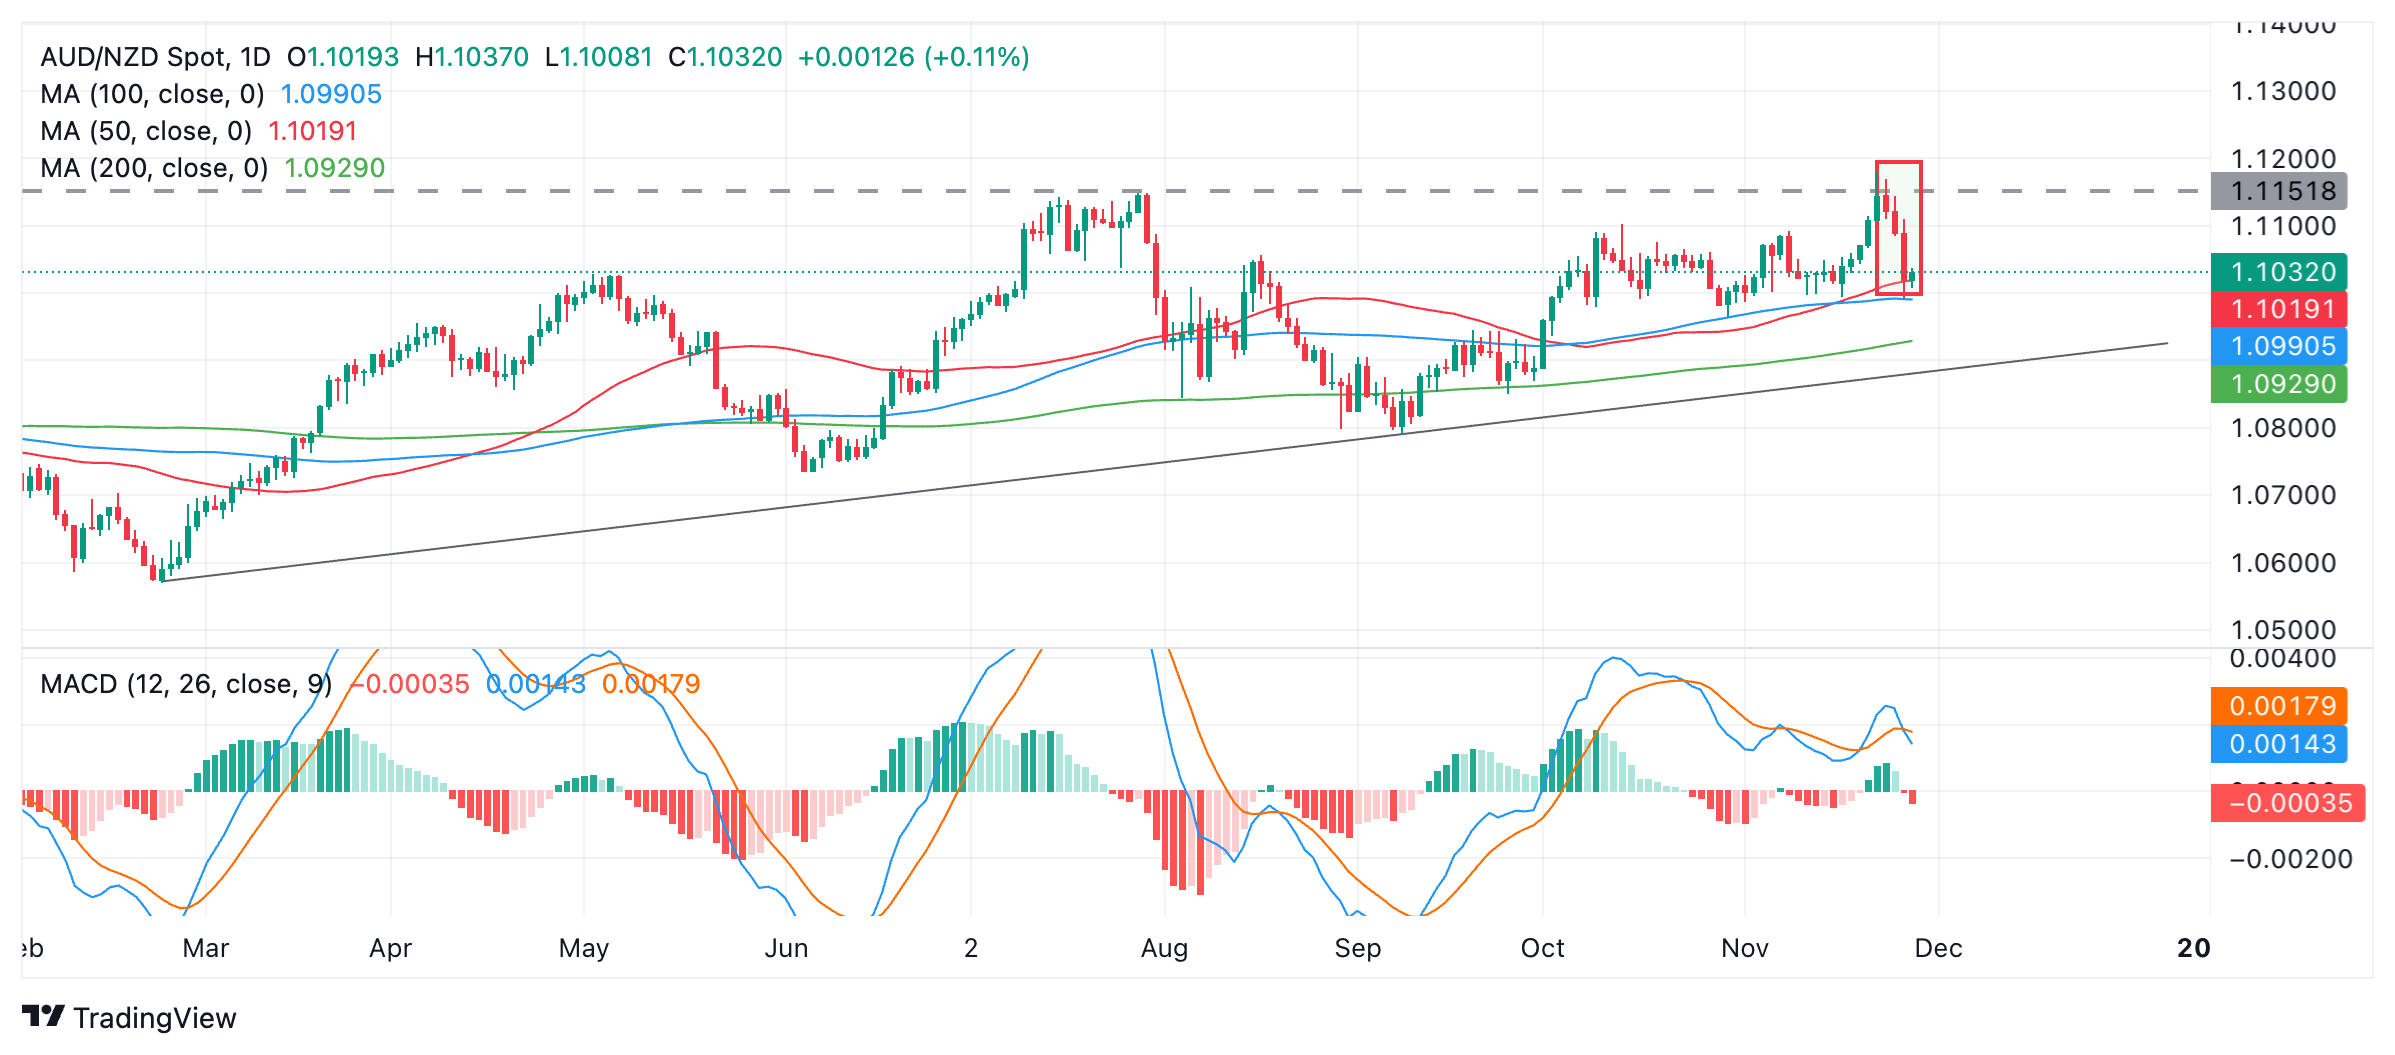
The Three Black Crows is a candlestick pattern that occurs after a market peak, when three consecutive days of bearish red candles occur. Such a pattern indicates that the odds favor AUD/NZD moving to lower lows.
The (blue) Moving Average Convergence/Divergence Indicator (MACD) has crossed below its red signal line, giving a sell signal and reinforcing the bearish candlestick pattern.
Support lies first at the 200-day SMA at 1.9029 and then at the trend line for the broader uptrend around 1.0900.
A break below the Three Black Crows low at 1.0992 would confirm a continuation towards the aforementioned targets.
Source: Fx Street
I am Joshua Winder, a senior-level journalist and editor at World Stock Market. I specialize in covering news related to the stock market and economic trends. With more than 8 years of experience in this field, I have become an expert in financial reporting.


