
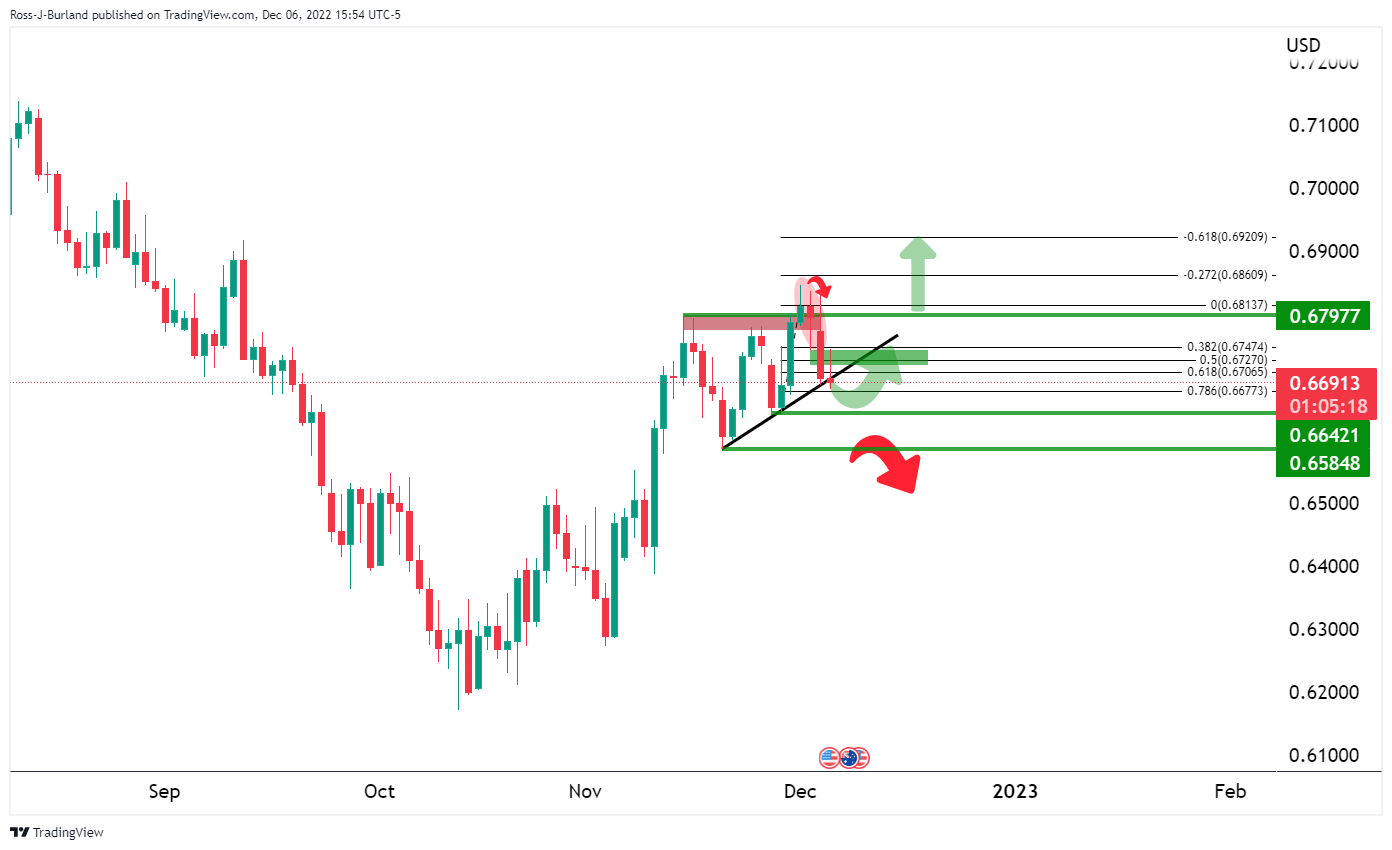
- AUD/USD fell to test a key technical zone on the daily chart.
- AUD/USD bears are eyeing a test below the trend line and a move below 0.6640/50 could be significant.
The AUD/USD pair came under pressure and fell 0.14% at the close on Wall Street following the previous day’s Reserve Bank of Australia (RBA) meeting, amid a risk-off environment in financial markets.
The RBA announced a 25 basis point rise, as expected, but stopped short of signaling a pause, as some analysts had anticipated. The RBA stated that it had not decided to tighten its monetary policy, but that inflation remained high. The Bank reaffirmed its tightening bias, signaling a further increase in inflation and wages. Meanwhile, Australia’s Gross Domestic Product (GDP) data today is expected to show growth of 0.7% qoq with annual GDP growth rising to 6.3%.
As for the dollar, on Tuesday it remained practically unchanged after the sharp rises of the day before, in a risk averse environment. Data this week showed the Institute for Supply Management (ISM) said its non-manufacturing PMI rose to 56.5 last month from 54.4 in October, indicating that the service sector, which accounts for more than two-thirds of activity The US economy remained resilient in the face of rising interest rates.
These data, combined with Friday’s surprising nonfarm payrolls and November wage growth, as well as news that consumer spending had picked up in October, raised optimism about avoiding a recession in 2023. Consequently, traders are currently expecting a half-point hike from the Fed next week and anticipating a terminal rate of slightly above 5% in May.
AUD/USD Technical Analysis
Based on the above analysis, AUD/USD Price Analysis: The eyes are on critical daily dynamic supportwhere a 50% mean reversion zone was observed near 0.6750, the bears have moved as follows:
Previous analysis:
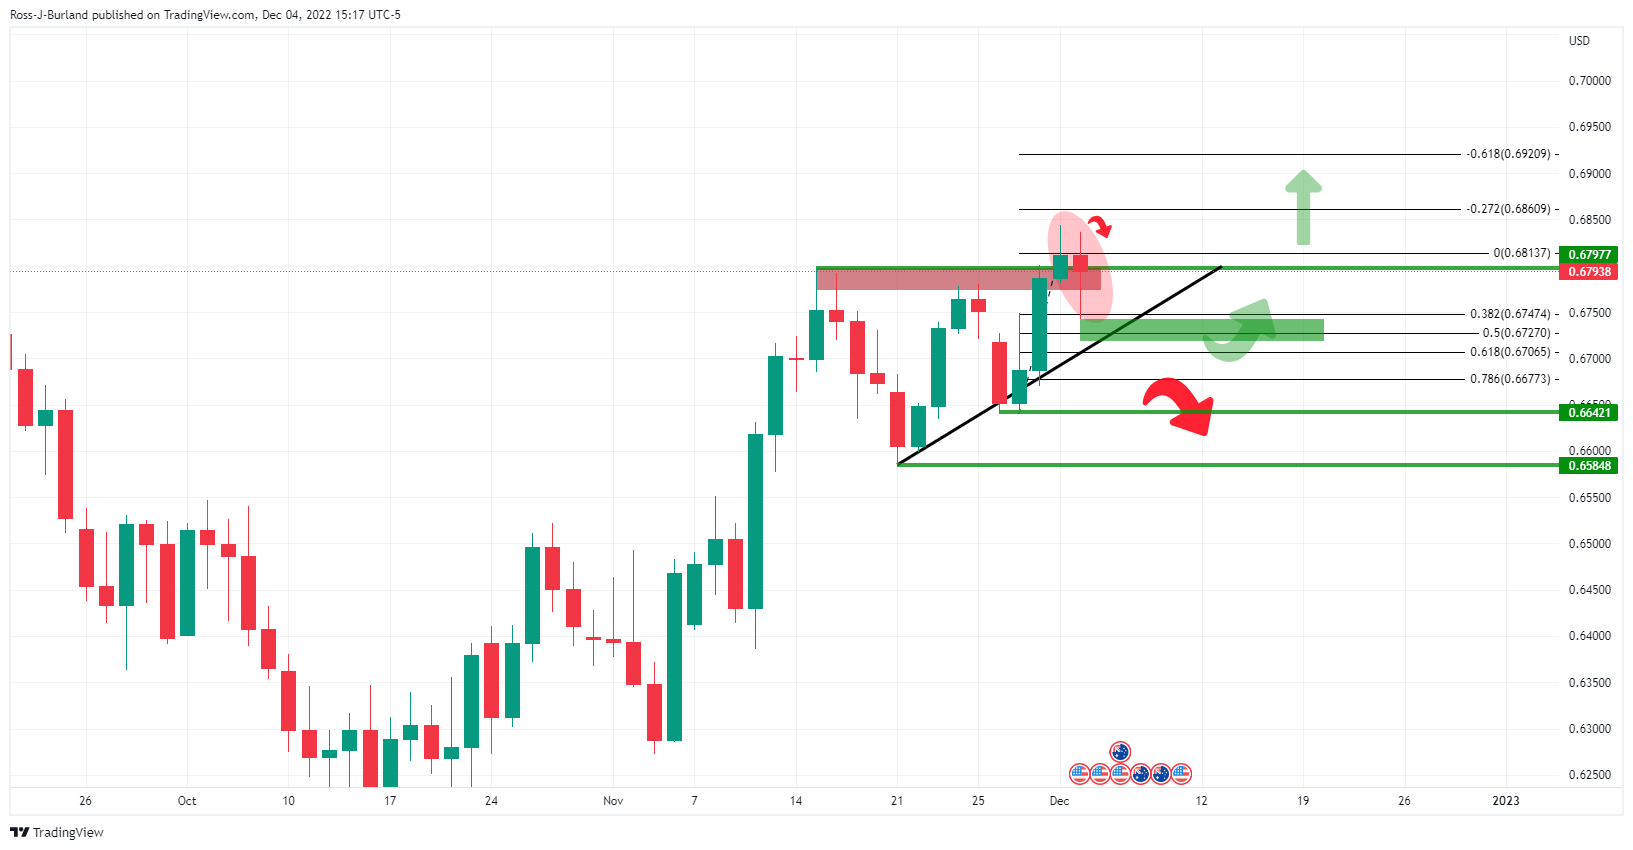
AUD/USD Update
If trend line support were to be broken now, a move below 0.6640/50 could be a major bearish event ahead of the critical calendar events remaining for the year.
Source: Fx Street
I am Joshua Winder, a senior-level journalist and editor at World Stock Market. I specialize in covering news related to the stock market and economic trends. With more than 8 years of experience in this field, I have become an expert in financial reporting.


