
- The US dollar continues to fall against the currencies of the antipodes.
- The Australian dollar is the most advanced currency this week.
- AUD/USD is trading at its highest level since May 11.
The pair AUD/USD it continued to rise and reached a fresh four-week high near 0.6740. It has maintained strong weekly gains, supported by a hawkish Reserve Bank of Australia (RBA) and a weaker US dollar.
The dollar is still under pressure this Friday, especially against the currencies of the antipodes, which are performing better. Although the RBA and the Bank of Canada have raised rates, the Federal Reserve (Fed) is expected to hit the pause button next week. At the same time, improving market sentiment is also helping to boost demand for AUD and NZD.
On Friday, China reported that the consumer price index rose 0.2% yoy and the producer price index stood at -4.6% yoy. The figures show that the impact of the reopening remains limited. The low inflation figures keep the door open for more stimulus from the Chinese authorities.
The best week in months for the AUD
The RBA rate hike and Governor Lowe’s comments on persistent inflation testing the council’s patience boosted the Australian dollar. Risk appetite flows and technical factors added fuel to the AUD/USD rally. The weak data from China was largely ignored.
AUD/USD is up almost 150 points for the week, marking its best performance since January. The price is currently testing the 20-week simple moving average (SMA), and a clear close above it would suggest that more gains are on the table. On the daily chart, the AUD/USD pair is testing the 100-day SMA and starting to consolidate above the 0.6715/20 resistance zone.
The technical outlook for the Australian dollar is positive. However, the main risk at this point could come from a reversal in risk flows and a hawkish surprise from the Federal Reserve next week.
AUD/USD weekly chart
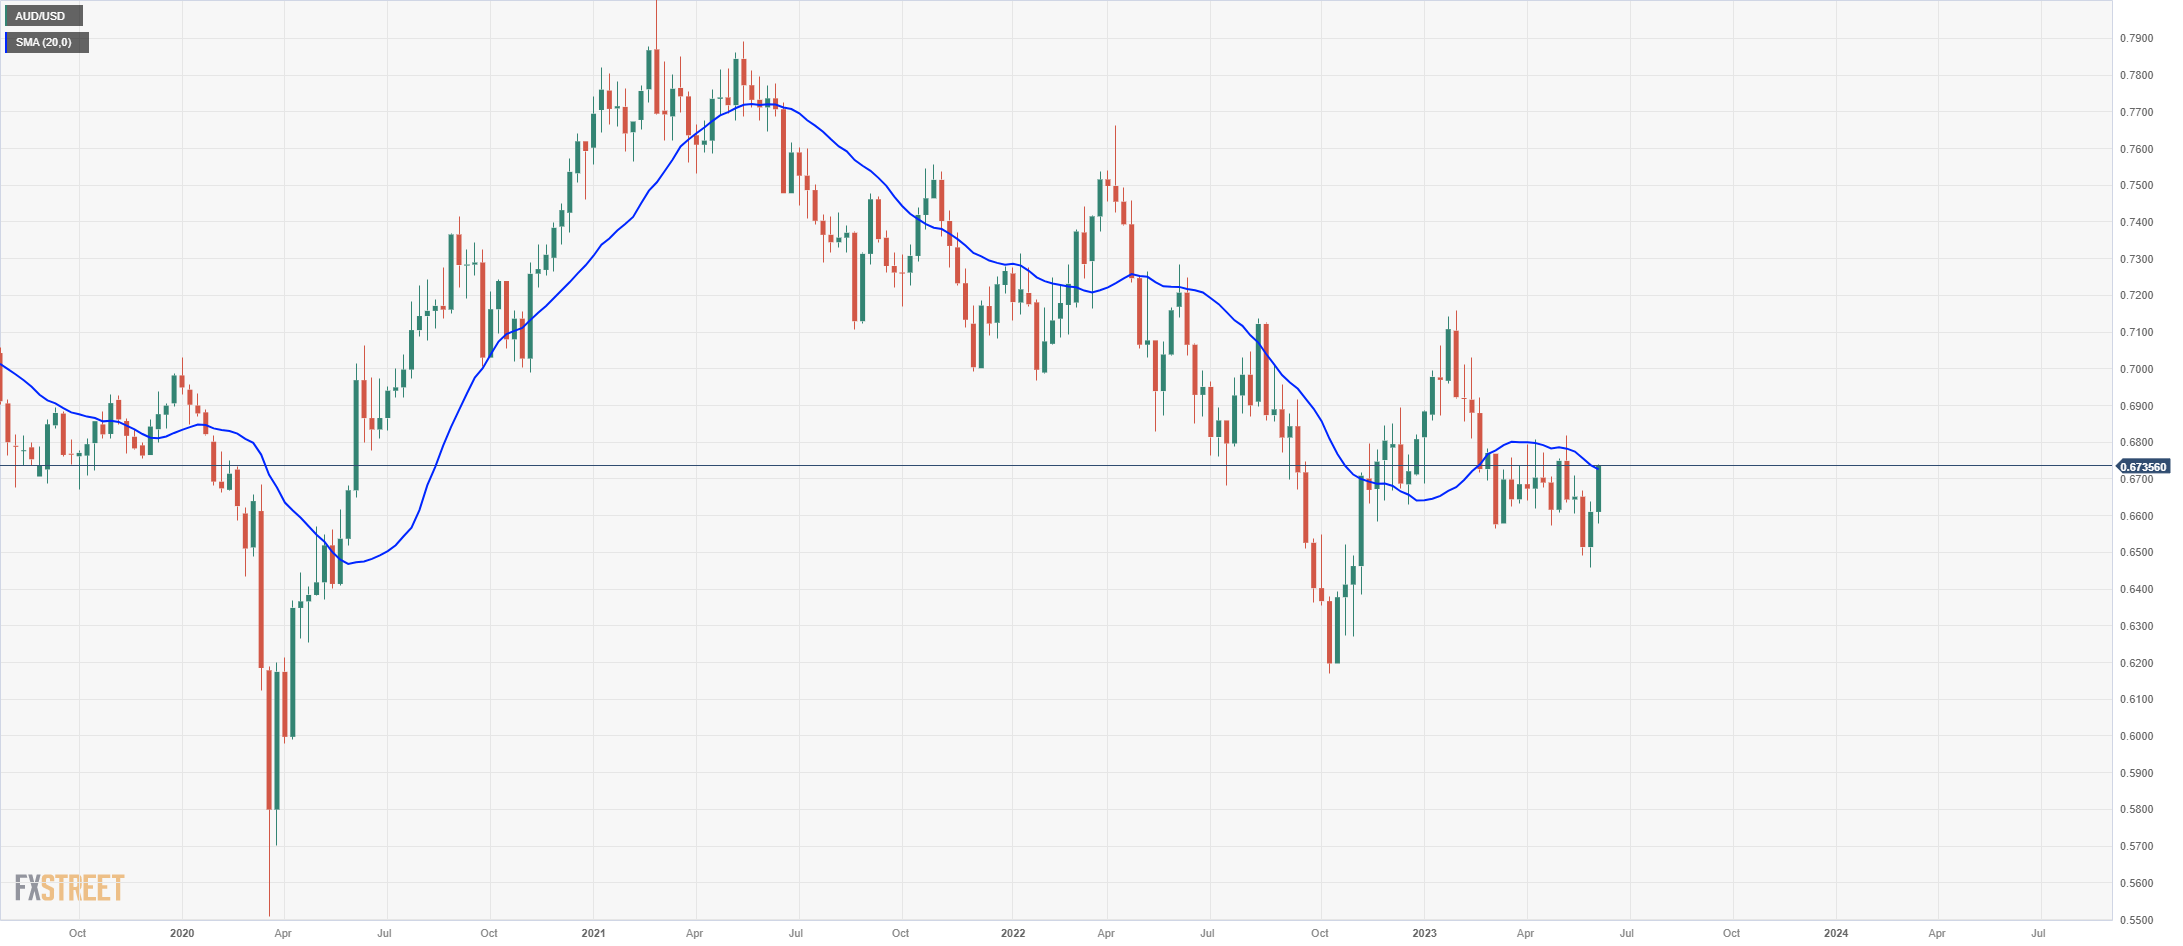
Source: Fx Street
I am Joshua Winder, a senior-level journalist and editor at World Stock Market. I specialize in covering news related to the stock market and economic trends. With more than 8 years of experience in this field, I have become an expert in financial reporting.


”")
