
- AUD/USD remains lower amid risks hanging over China and Taiwan.
- Rising copper and iron ore prices, combined with a weakening dollar, cap AUD losses.
- Bulls remain hopeful while above the 100-day SMA and ahead of key US inflation data.
AUD/USD trades slightly below 0.7000, struggling for a clear directional move amid cautious risk sentiment, broad US dollar weakness and rising industrial metals prices.
The implications of these various factors have left AUD/USD teetering in a tight 30 pip range. The calm in the trade around the currency pair could also be associated with the caution before the publication of the inflation data in the US. Investors remain on the sidelines before the key risk this week, which will take the Fed to decide on a possible rate hike of 75 basis points next month.
The US dollar, however, extends the previous decline, in anticipation of softer annualized inflation in the US, even as Treasury yields attempt a small rebound during the European session. Therefore, the pair’s decline continues to be supported by a weaker dollar.
Additionally, impressive Chinese export data and strong copper and iron ore prices are also helping the pair stay afloat as investors assess the upbeat National Australia Bank (NAB) business survey for July.
On the downside, the main risk for the Australian dollar remains the brewing conflict between China and Taiwan over the visit of US House Speaker Nancy Pelosi last week. China continues to carry out military exercises near the Taiwan Strait, which makes the latter think that Beijing is preparing to invade Taipei. Markets now remain focused on Wednesday’s US inflation data.
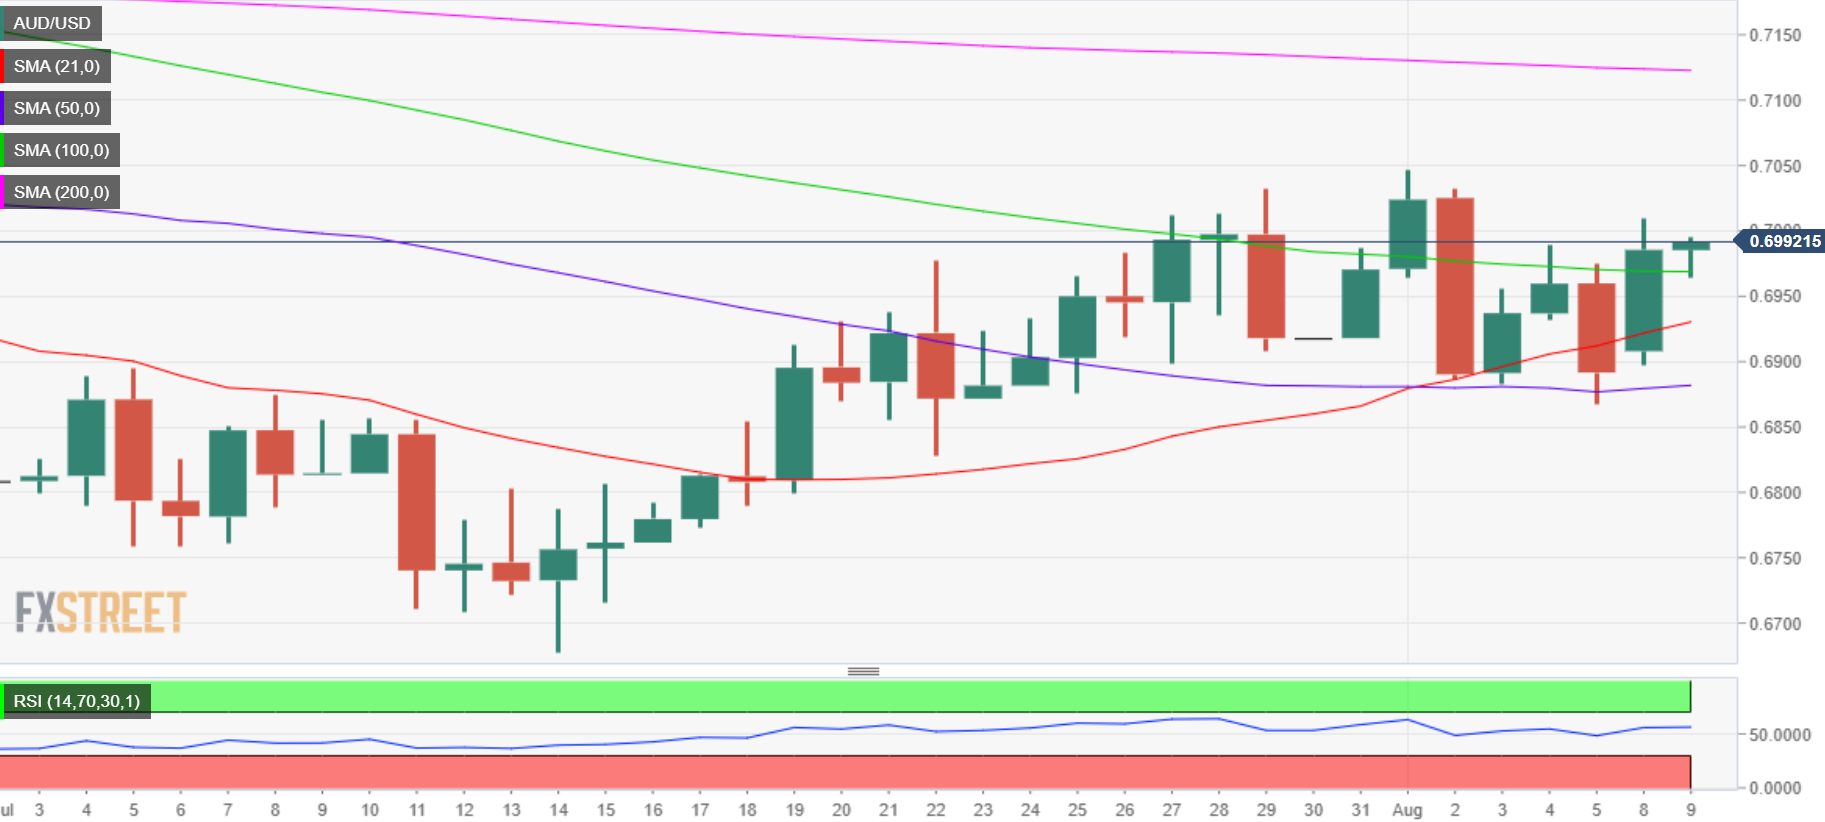
AUD/USD has managed to defend the 100-day simple moving average (SMA) support at 0.6966 so far on Tuesday, which has reignited bullish interest.
The bulls are now looking for acceptance above 0.7000 to start any significant attempts higher.
The next target for AUD buyers is near 0.7050, the confluence of the psychological level and the previous week’s high.
The 14-day RSI is trading flat above its midline, suggesting there could be more room for upside.
On the other hand, a sustained move below the 100 SMA will put the upsloping 21 SMA at 0.6930 at risk. Further declines will challenge the bulls commitment around the 0.6900 round level.
AUD/USD daily chart
AUD/USD additional levels
Source: Fx Street
With 6 years of experience, I bring to the table captivating and informative writing in the world news category. My expertise covers a range of industries, including tourism, technology, forex and stocks. From brief social media posts to in-depth articles, I am dedicated to creating compelling content for various platforms.


.jpg "Summer in your eyes: is Conrad Fisher the Leonardo DiCaprio della Gen Z?")
