
- Traders were surprised by US inflation in August, which beat forecasts.
- The risk aversion momentum weighed on US equities, along with high beta currencies such as the Australian dollar.
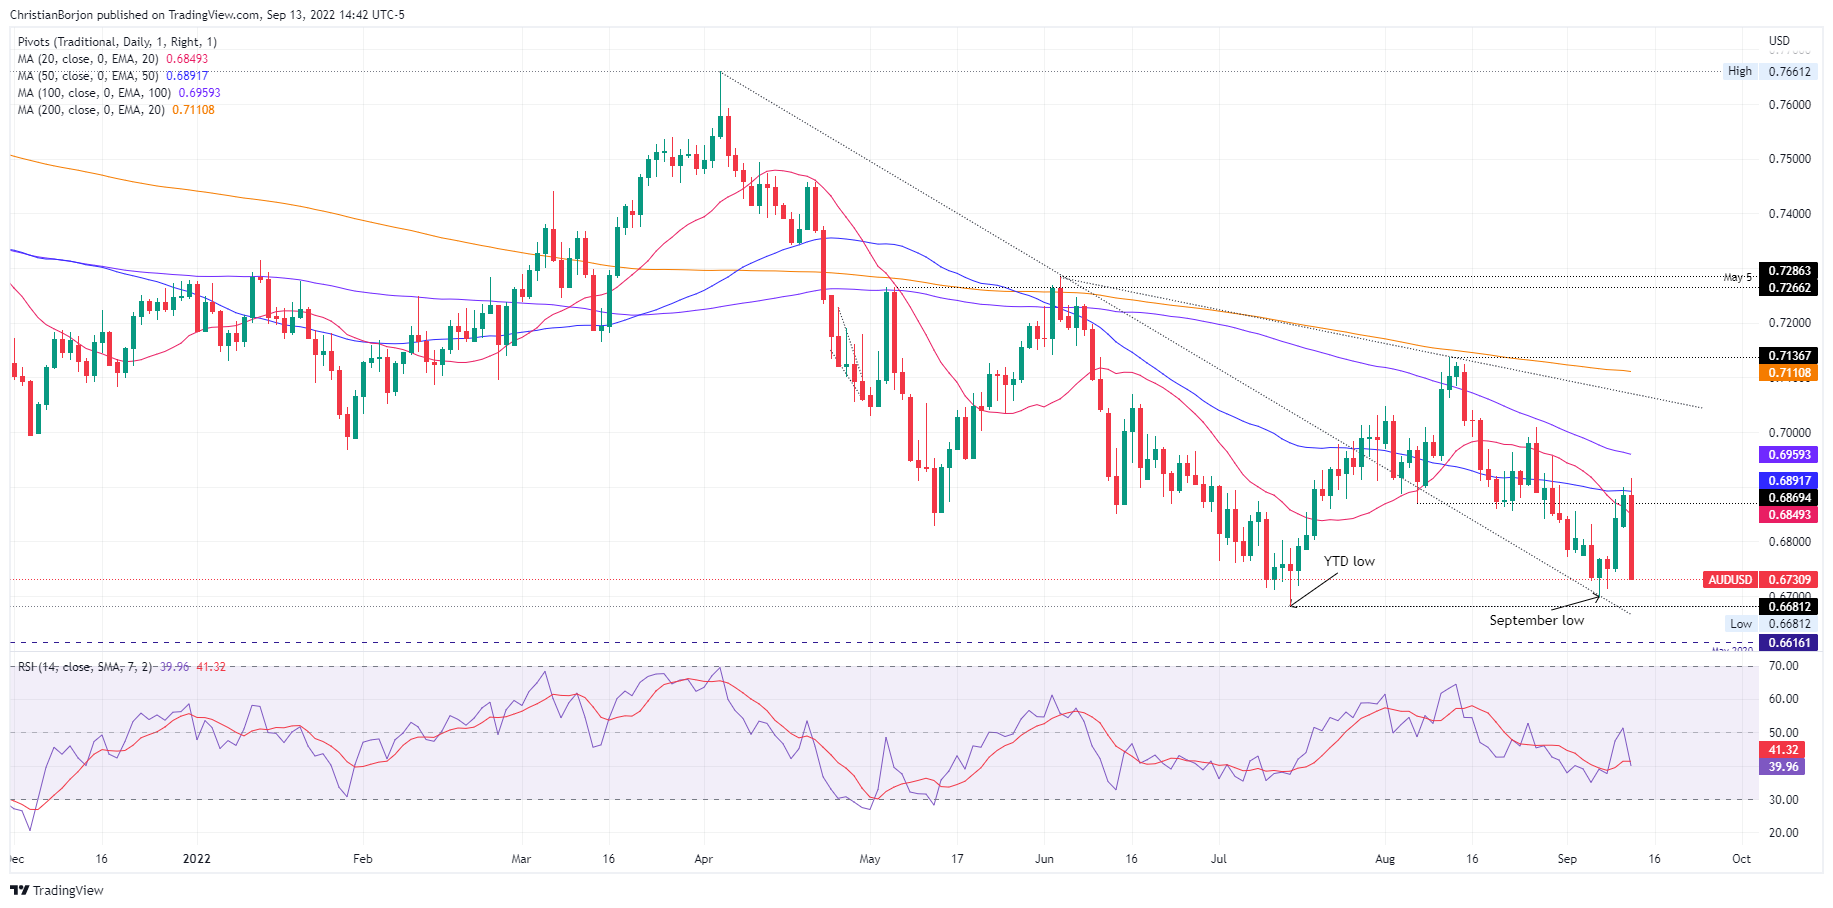
- AUD/USD Price Analysis: Traders are on the lookout for a retest of the September low at 0.6698.
The AUD/USD lost more than 2% on renewed fears about US inflation, which beats estimates but slows compared to the previous month’s reading. However, a surge of risk aversion sent US equities down between 3.52% and 5.00%, meaning market players were expecting a lower reading.
Nearing the end of the American session, the AUD/USD pair is trading at 0.6736, well below its opening price, after reaching a daily high of 0.6916.
The US Department of Labor reported that August inflation in the US came in at 0.1% mom, above the -0.1% contraction forecast by analysts, while in annual terms, it rose to 8.3%, against the consensus of 8.1%. Excluding volatile items such as food and energy, the so-called Consumer Price Index (CPI) rose 0.6% month-on-month in the same period, above estimates of 0.3%, while the year-on-year reading rose 6.3%, exceeding forecasts of 5.9%.
Elsewhere, the US dollar index, a gauge of the dollar’s value against a basket of peers, rose on expectations of a 100 basis point interest rate hike in September, up 1.39%, to 109,816, supported due to the rise in US Treasury yields, which stood at 3.422%, with an increase of six basic points.
Regarding the Australian dollar, the country’s economic calendar was characterized by business consumer confidence, whose data increased one point to +20 in August, according to the National Australia Bank (NAB). The survey showed prices slipped in August to 4.4%, from an all-time high of 5.3% in July, though this is unlikely to deter the Reserve Bank of Australia from raising prices, albeit at a slower pace.
AUD/USD Price Analysis: Technical Outlook
From a daily chart point of view, the AUD/USD has a bearish bias after failing to recapture the 20 and 50 day EMAs at 0.6849 and 0.6891 respectively. AUD/USD traders should note that the Relative Strength Index (RSI) has crossed below its 7-day SMA, indicating that the sellers are gaining momentum. Therefore, in the short term, a retest of the monthly low at 0.6698 could be expected.
Technical levels
Source: Fx Street
With 6 years of experience, I bring to the table captivating and informative writing in the world news category. My expertise covers a range of industries, including tourism, technology, forex and stocks. From brief social media posts to in-depth articles, I am dedicated to creating compelling content for various platforms.


