
- AUD/USD advances towards 0.6700 as the RBA is expected to raise rates to 4.35%.
- The DXY Dollar Index is expected to stay sideways as investors await the US CPI release.
- AUD/USD has seen a buying response despite a breakout of consolidation to the downside.
The AUD/USD pair has extended its rally and rises towards the resistance at the 0.6700 round level during the European session on Thursday. The pair has resumed its bullish path as the DXY Dollar Index has extended its decline.
The DXY index is expected to remain sideways as investors await the release of the US Consumer Price Index (CPI) next week.
The Australian dollar has gained strength as the Reserve Bank of Australia (RBA) is expected to continue raising interest rates despite the deteriorating Australian economic outlook. A Reuters poll showed the RBA would increase its Official Cash Rate (OCR) by 25 basis points (bps) to 4.35%.
AUD/USD has seen a buying response, despite a breakout of the consolidation formed in a range of 0.6563-0.6808 on the daily chart. The lack of continued selling in the pair after the breakout of consolidation triggered a strong rally. The buying response indicates that investors viewed the pair as a value bet.
The AUD/USD has broken above the 20 period EMA at 0.6607, indicating that the short-term trend has turned bullish.
Meanwhile, the Relative Strength Index (RSI) (14) has bounced to the 40-60 range from the bearish 20-40 range, indicating that bearish momentum has receded.
If AUD/USD breaks above the June 7 high at 0.6718, Australian dollar bulls will lead the pair towards the April 18 high at 0.6748, followed by the May 10 high at 0.6818.
On the other hand, if the pair breaks below the June 1 low at 0.6484, bears will drag AUD/USD towards the November 1, 2022 high at 0.6464, followed by round level support at 0.6400.
AUD/USD daily chart
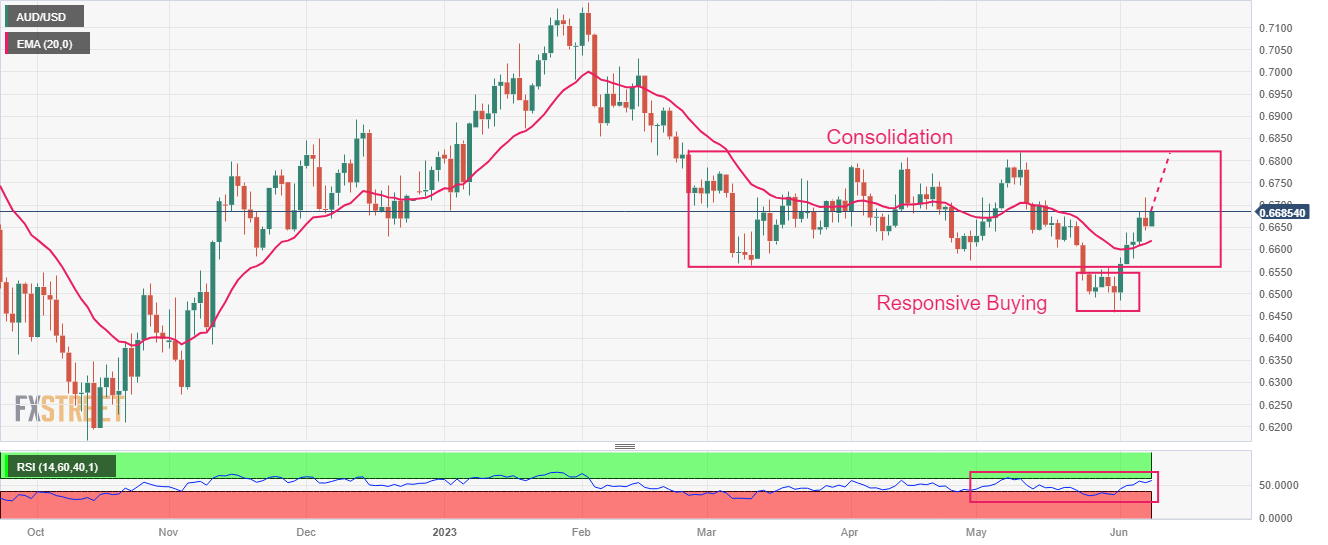
Source: Fx Street
I am Joshua Winder, a senior-level journalist and editor at World Stock Market. I specialize in covering news related to the stock market and economic trends. With more than 8 years of experience in this field, I have become an expert in financial reporting.


