
- AUD/USD bears break the 4-hour support trend line.
- 0.6650b and then 0.6580 will be key to leave bears fully in control, with 0.6550 and 0.6500 in sight.
Protests against China’s strict zero-COVID policy and restrictions on freedoms in the country have led to a risk-averse start to the week, weighing heavily on the Aussie, as the following technical analysis shows. AUD/USD has lost 1.13%, moving from a high of 0.6727 to a low of 0.6665 so far this day.
AUD/USD daily chart
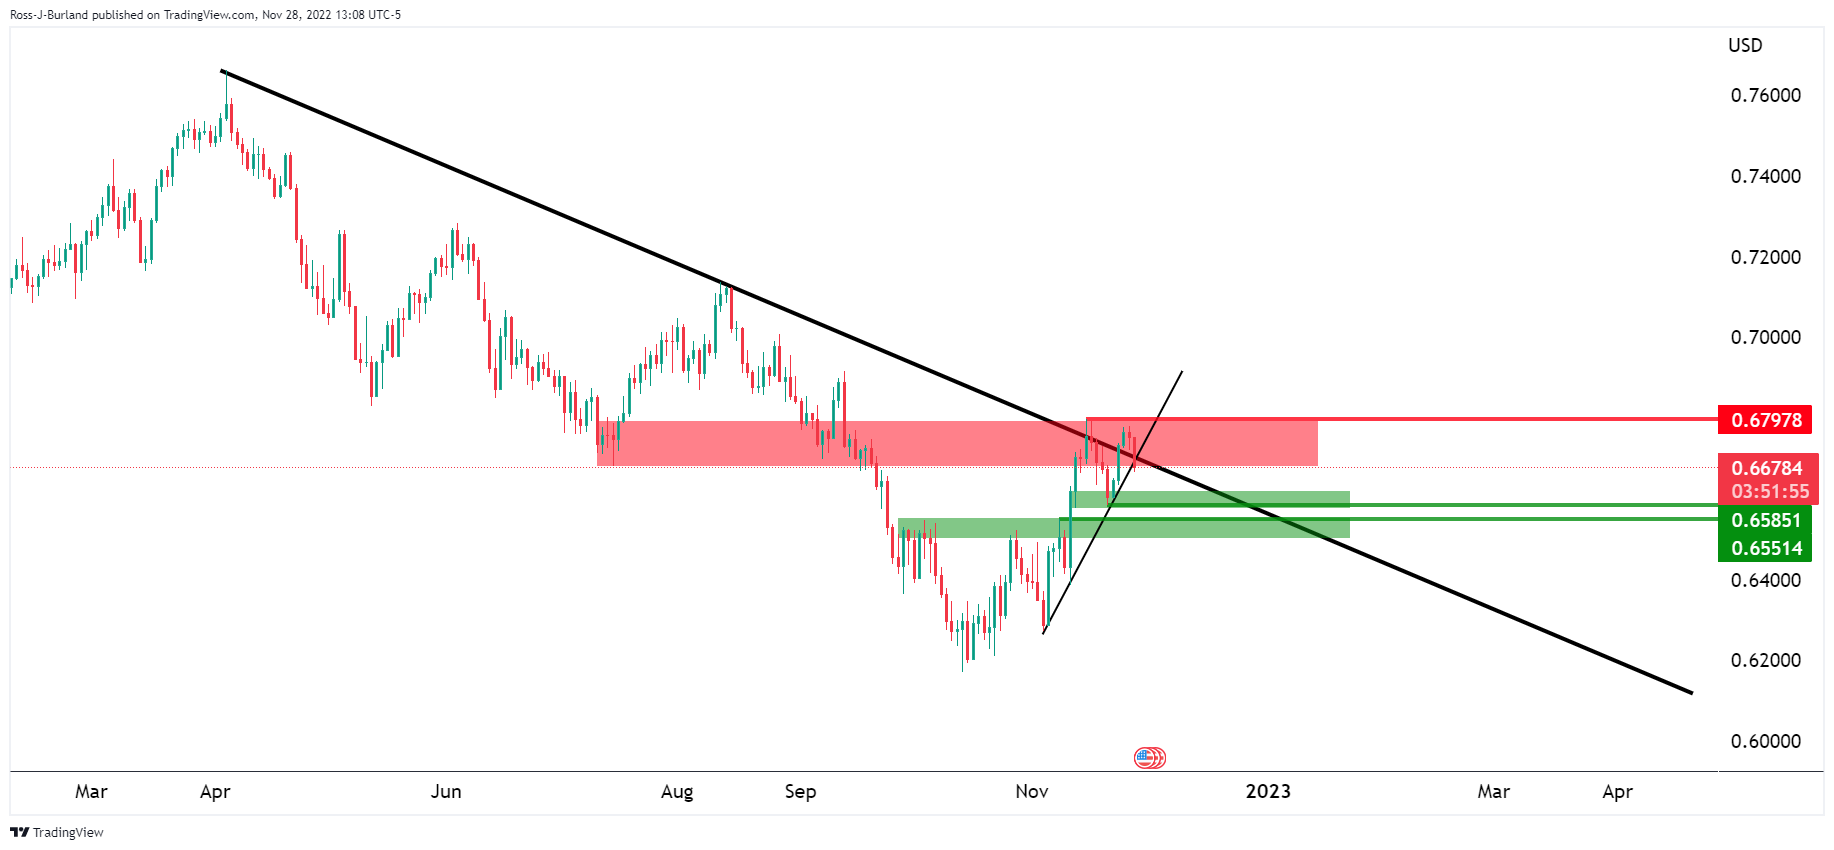
Price is testing trend line support on the daily chart, with resistance at a double top on the daily structure, as shown on the chart above. The bias is downward as shown below:
AUD/USD H4 Chart
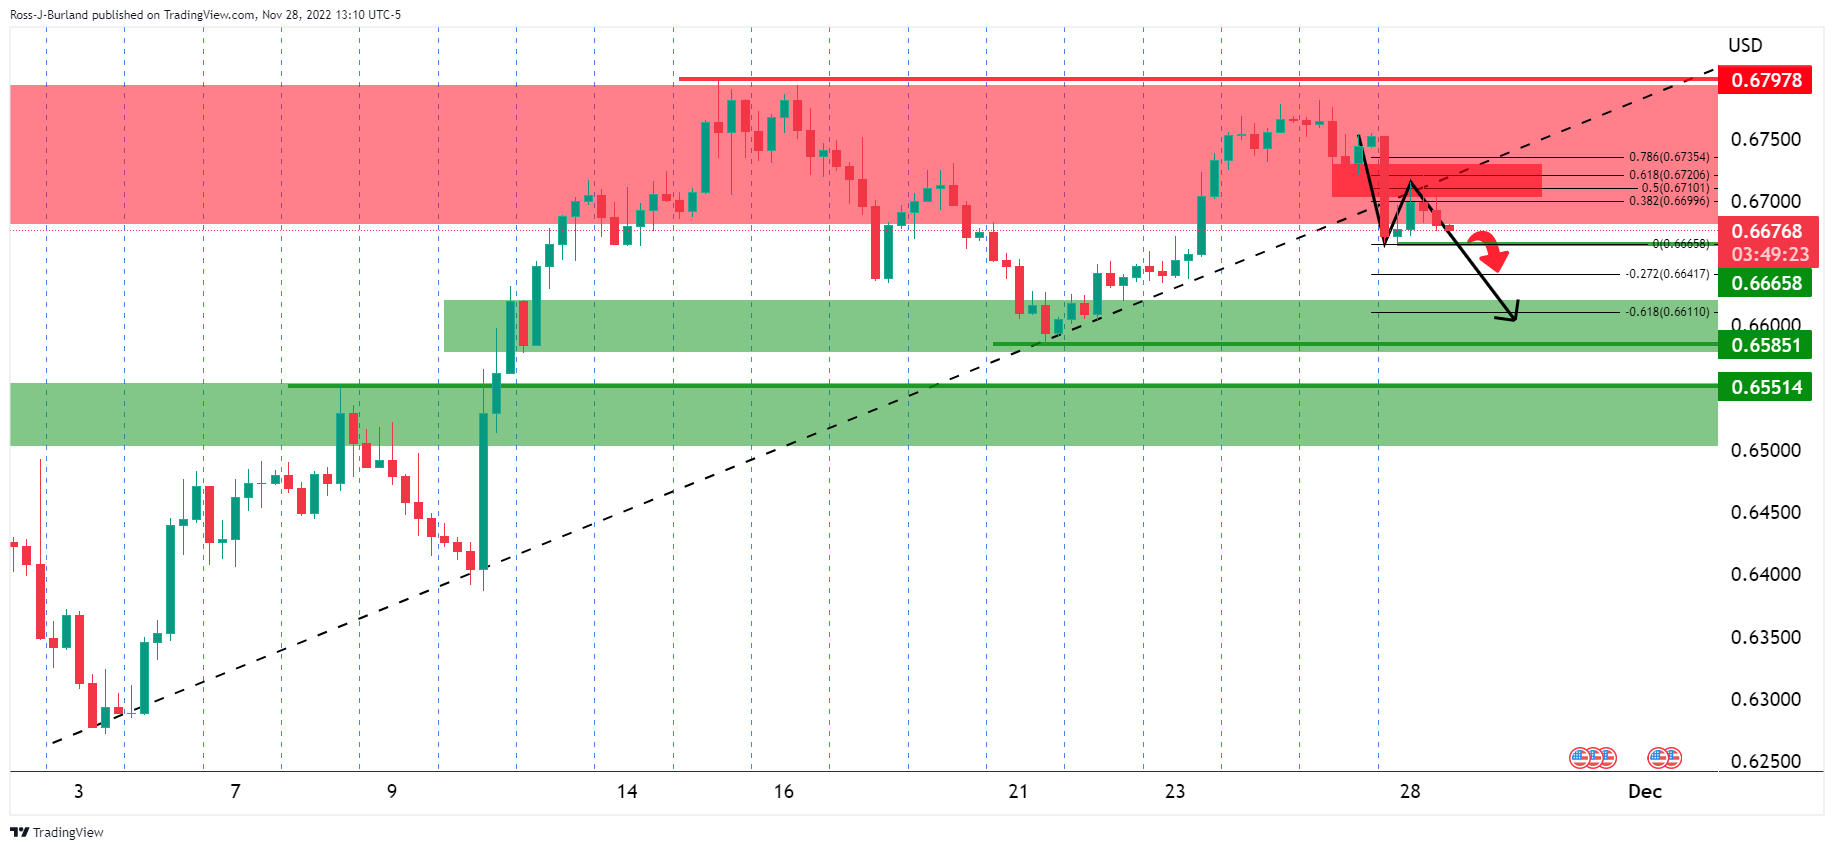
On the 4 hour time frame, the price is testing below the trend line and after a correction on the Fibonacci scale, the bears have re-entered. This puts the focus on the recent lows of 0.6665. However, it won’t be until price breaks below 0.6650 and then 0.6580 that the bears will be in full control with 0.6550 and 0.6500 in their sights.
Source: Fx Street
I am Joshua Winder, a senior-level journalist and editor at World Stock Market. I specialize in covering news related to the stock market and economic trends. With more than 8 years of experience in this field, I have become an expert in financial reporting.


