
- AUD/USD moves lower on RBA dovish attitude and US-China issues over Taiwan.
- The RBA raises key rates by 50 basis points but says it is not on a pre-set tightening path.
- A possible breakout of the ascending channel on the daily chart points to the 21-day SMA at 0.6873.
AUD/USD remains below 0.6900, shedding almost 1.50% on the day, as AUD bulls continue to face a double whammy this Tuesday.
Risk aversion remains in full swing as markets remain anxious ahead of US House Speaker Nancy Pelosi’s expected visit to Taiwan around 14:30 GMT. The United States is undeterred by Chinese threats, but Beijing and Taipei have stepped up their military responses in a show of force, while Pelosi visits the self-ruled island claimed by the Dragon Nation.
Another reason for the Aussie’s selling is the dovish signal from the Reserve Bank of Australia (RBA) during its monetary policy meeting. The RBA raised the key rate by 50 basis points to 1.85% this month, as expected. However, the central bank signaled that it is not on a pre-set tightening path, somewhat abandoning the forward guidance, causing the Australian dollar to slide further.
All eyes are now on Pelosi’s arrival in Taipei, which could trigger a new wave of risk aversion at the start of the American session. Meanwhile, the pair also remains exposed to downside risks as it is on track to confirm a breakout of a rising wedge on the daily chart.
AUD/USD has broken the horizontal support of the 50-day moving average at 0.6966, which has opened the way to the downside.
A daily close below the rising trendline support at 0.6952 will validate the downtrend channel breakout.
The next relevant level on the downside is at 0.6873, which is the 21-day SMA.
The 14-day RSI is attacking the midline, which suggests that there is more room to the downside.
AUD/USD daily chart
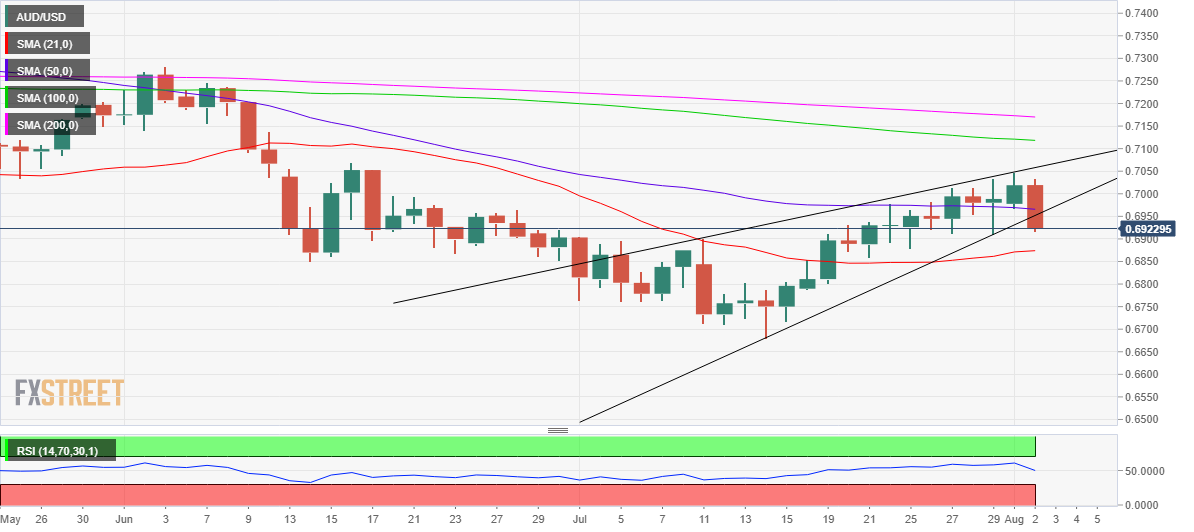
On the other hand, recovering the 50 SMA is essential to start a significant recovery towards 0.7000.
Further up, the intraday high of 0.7034 will be a tough nut to crack for bulls in the pair.
AUD/USD additional levels
Source: Fx Street
With 6 years of experience, I bring to the table captivating and informative writing in the world news category. My expertise covers a range of industries, including tourism, technology, forex and stocks. From brief social media posts to in-depth articles, I am dedicated to creating compelling content for various platforms.


