
- AUD/USD halts rally below 38.2% Fibonacci.
- Selling around the dollar is unimpressive amid Covid lockdowns in southern China.
- The daily RSI remains below 50, keeping the bearish bias intact.
AUDUSD pulls back from daily highs of 0.6988 as bulls take a breather after the latest move higher. Investors weigh comments from Reserve Bank of Australia (RBA) Governor Philip Lowe, as well as the June meeting minutes.
The Aussie’s prolonged bounce comes on the back of continued US dollar selling across major pairs as risk appetite flows dominate the European session and reduce the safe-haven appeal of the US dollar. The markets seem to ignore the risks of recession that are coming.
However, bulls in the pair are cautious about further closings in Shenzhen and Macau as covid outbreaks have spread to southern China. “A single local case in Shenzhen detected on Saturday triggered mass testing and neighborhood closures in parts of the tech hub. Two cases were ultimately reported on Saturday, and none on Sunday,” according to Bloomberg.
All eyes are now on US housing data and comments prepared from Fed Chairman Jerome Powell’s testimony due later in the American session.
From a short-term technical perspective, AUD/USD has halted its rally as the bulls have lost momentum once again below the critical 0.7000 level, which is the 38.2% Fibonacci retracement of the last decline since the June 7 highs at 0.7247 to June 14 lows at 0.6850.
That said, AUD/USD could continue to slide towards the Fibonacci 23.6% at 0.6944 if the bears take control.
Monday’s low at 0.6917 will be the next target on sellers’ radar. The 14-day RSI is trading flat but below the 50 level, which suggests that the upside attempts are likely to remain shallow.
AUD/USD daily chart
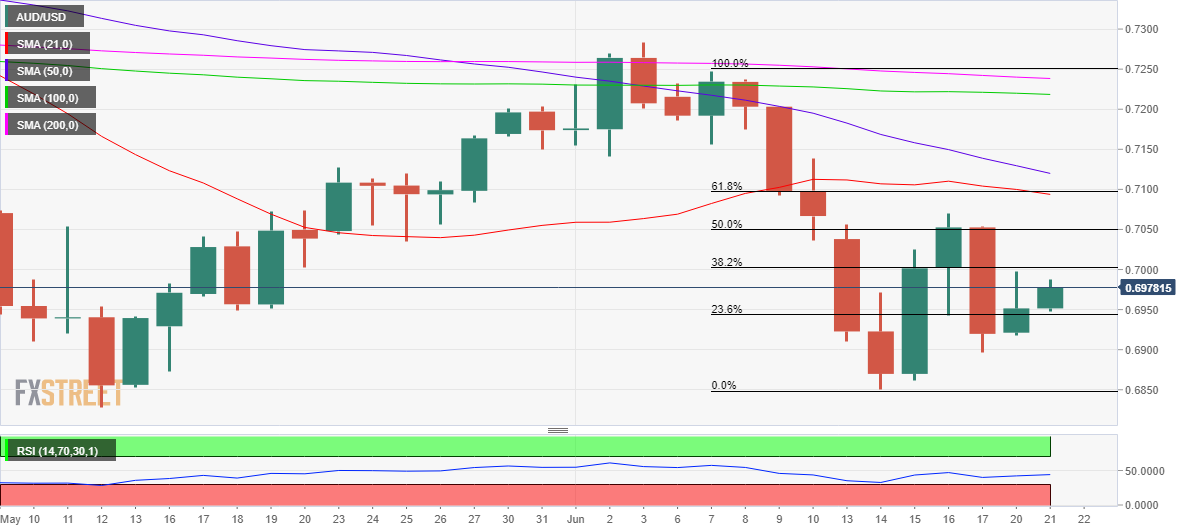
On the other hand, if AUD/USD manages to find acceptance above the aforementioned critical resistance at 0.7000, a further rally towards 0.7050 cannot be ruled out. In that zone coincide the maximum of Friday and the 50% of Fibonacci.
A sustained move above that barrier is needed to regain bullish traction towards the confluence of the 61.8% Fibonacci and the bearish sloping 21-Day SMA near 0.7100.
AUD/USD additional levels
Source: Fx Street
With 6 years of experience, I bring to the table captivating and informative writing in the world news category. My expertise covers a range of industries, including tourism, technology, forex and stocks. From brief social media posts to in-depth articles, I am dedicated to creating compelling content for various platforms.


