
- AUD/USD recoups post-RBA losses and rises to a one-week high on Tuesday.
- USD selling continues as risk appetite supports risk sensitive AUD.
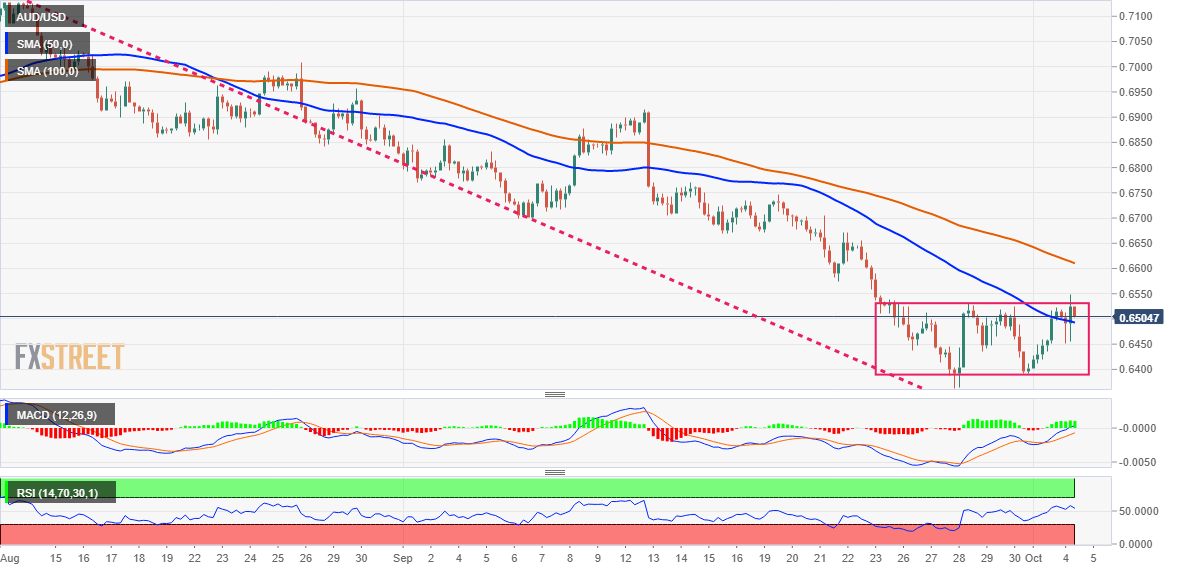
- The one-week range marks a bearish consolidation phase and warrants caution among investors.
The AUD/USD pair reverses its intraday losses fueled by the Reserve Bank of Australia’s 25 basis point rate hike, less than expected, and rises to a one-week high during the early part of the European session. However, the rally lacks continuation and stops just short of the 0.6550 level.
The US dollar continues its recent corrective pullback from two-decade highs reached last week, amid a further decline in US Treasury yields. Apart from this, risk appetite is further weighing on the safe-haven US dollar, driving money flows into the risk-sensitive AUD.
Generally speaking, the AUD/USD pair has been trading in a tight range for the past week. The ranging price action forms a rectangle formation on the intraday charts and points to indecision among traders about the next directional move.
Against the background of a sharp drop from the August monthly high, the formation could still be classified as a bearish consolidation phase. Furthermore, the technical indicators on the daily chart, although they have recovered from lower levels, remain in bearish territory.
This, in turn, suggests that the path of least resistance for the AUD/USD pair is to the downside and warrants caution for the bulls. That said, some continuation buying will negate the downtrend and set the stage for a significant near-term appreciation move.
The AUD/USD pair could take advantage of its recent bounce from its lowest level since April 2020 and try to reclaim the 0.6600 level. This is followed by the 0.6620-0.6625 resistance zone, above which a further short-covering move could lift the pair to the 0.6700 level.
On the other hand, the post-RBA low around 0.6450 seems to protect the immediate drop ahead of the round 0.6400 level. A convincing break below that level will make the AUD/USD pair vulnerable to weaken further below the yearly low around the 0.6365-0.6360 area and test the 0.6300 level.
AUD/USD 4 hour chart
AUD/USD key levels
Source: Fx Street
With 6 years of experience, I bring to the table captivating and informative writing in the world news category. My expertise covers a range of industries, including tourism, technology, forex and stocks. From brief social media posts to in-depth articles, I am dedicated to creating compelling content for various platforms.


