
- AUD/USD finds fresh offers at high levels and trims some of its intraday gains.
- A nice dollar rebound from the weekly low puts downward pressure on the pair.
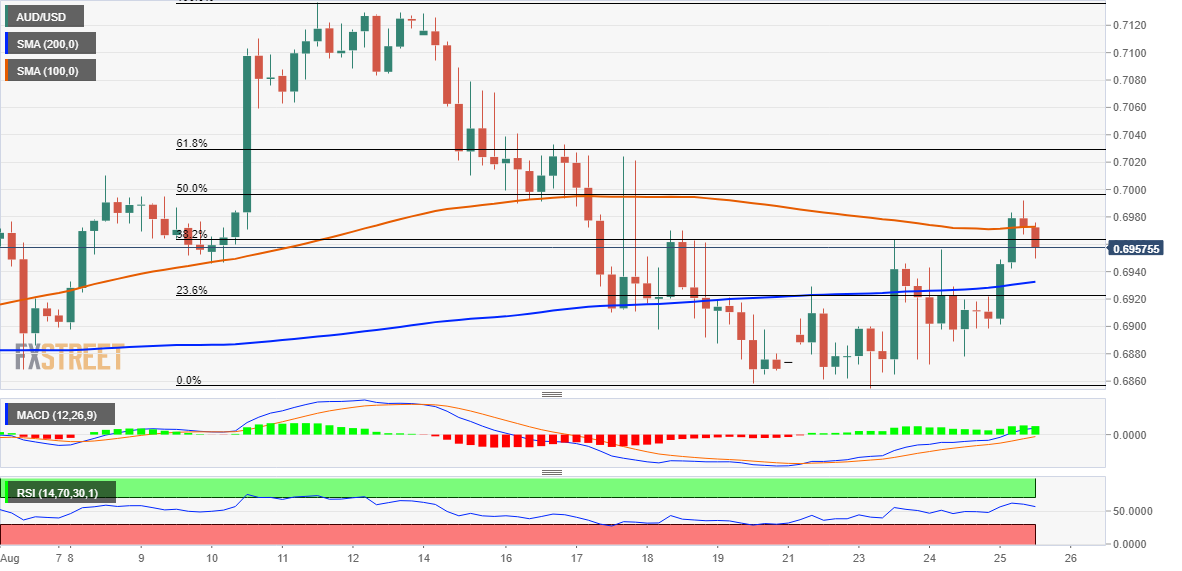
- Any further decline is likely to find good support near the 0.6935-0.6925 confluence.
The pair AUD/USD It attracts some selling near the key psychological level of 0.7000 and trims some of its early gains to the one-week highs hit this Thursday.
The US dollar rebounds quickly from the weekly low after the release of better-than-expected US macroeconomic data, which reaffirms the Fed’s expectations. In addition, an intraday turn in the equity markets further benefits the safe-haven status of the USD and It acts as a headwind for the risk-sensitive Aussie.
From a technical point of view, the AUD/USD is struggling to find acceptance above the 100-period SMA on the 4-hour chart. The positive intraday move stalls near the 50% Fibonacci retracement level of the recent decline seen in the last two weeks or so. The latter should serve as a benchmark for short-term traders.
Meanwhile, the neutral oscillators on the daily chart warrant caution before making aggressive directional bets. This, in turn, suggests that any subsequent pullback is more likely to find decent support near the 0.6935-0.6925 confluence support. This region comprises the 200-period SMA on the 4-hour chart and the 23.6% Fibonacci level.
Sustained weakness below the latter will suggest this week’s recovery move has run its course and make the AUD/USD pair vulnerable. The pair could break the 0.6900 mark and test the horizontal support at 0.6860-0.6855. Some follow-up selling will be seen as a new trigger for the bears.
On the other hand, the 50% Fibonacci level, just before 0.7000, now seems to act as a strong immediate resistance, above which the AUD/USD pair could rally to the 0.7030 area (61.8% Fibonacci level). The momentum could extend further and allow the pair to reclaim the round 0.7100 level.
AUD/USD 4-hour chart
Technical levels
Source: Fx Street
With 6 years of experience, I bring to the table captivating and informative writing in the world news category. My expertise covers a range of industries, including tourism, technology, forex and stocks. From brief social media posts to in-depth articles, I am dedicated to creating compelling content for various platforms.


