
- AUD/USD has a bearish bias, but the weakness of the US dollar pushed the price of the pair higher.
- Investors’ flight to safe havens did little to boost the USD on Tuesday as it fell.
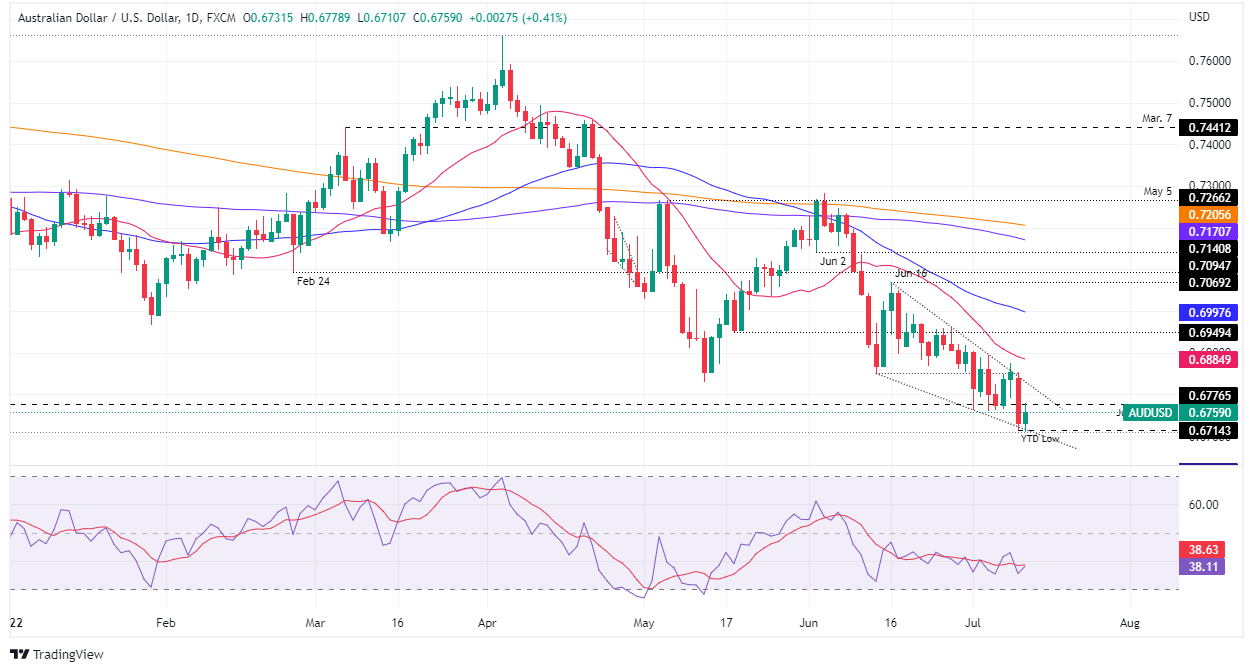
- AUD/USD Price Analysis: The daily chart illustrates the appearance of a falling wedge, pointing to a rally towards 0.7000.
On Tuesday, the AUD/USD rose from record lows around 0.6714 amid a fragile market mood that turned sour as the Wall Street close approached, a reflection of US recession concerns as that traders feared the Fed’s tightening cycle could push the US economy into a recession.
AUD/USD is trading at 0.6759 at the time of writing, after having reached a daily high around 0.6779, reinforced by the weakness of the US dollar, and despite the resurgence of covid-19 in China, especially in Shanghai, as authorities ordered mass testing across the city.
AUD/USD daily chart
AUD/USD remains heavy, although recovering some ground during the day. But the sellers remain in control due to a few factors: the daily moving averages (DMAs) reside above the exchange rate, the oscillators are in bearish territory, and the failure of the AUD buyers to recapture the 0.7000 figure. it opened the door to more selling pressure. Therefore, the path of least resistance for AUD/USD is to the downside.
The first demand area for AUD/USD would be last year’s low around 0.6714. A break below will expose the 0.6700 figure, followed by a drop to the 22 May 2020 swing low at 0.6505.
However, there is a ray of hope for AUD buyers. AUD/USD has formed a falling wedge in a downtrend, which means a break above the upper trend line could open the door for further gains. Therefore, the first resistance for AUD/USD would be the ti trendline around 0.6830. A breakout of the latter will expose the 20-day EMA around 0.6884, followed by the 100-day EMA near the 0.7000 area, near 0.6997.
Technical levels
Source: Fx Street
With 6 years of experience, I bring to the table captivating and informative writing in the world news category. My expertise covers a range of industries, including tourism, technology, forex and stocks. From brief social media posts to in-depth articles, I am dedicated to creating compelling content for various platforms.


