
- The AUD/USD pair has hit two-month highs as the US Dollar plunges after the NFP.
- Market sentiment has shifted firmly toward risk appetite as investors no longer fear further Fed rate hikes.
- Markets expect the RBA to apply an additional 25 basis points.
The pair AUD/USD is setting nine-week highs above the 0.6500 area as AUD takes advantage of USD weakness following the Non-Farm Payrolls release, and market risk-on sentiment is pushing AUD to its sixth green candle. of the last seven consecutive trading days.
Global markets turned the US dollar around, dumping the safe-haven asset and entering riskier assets after a worse-than-expected NFP reading that saw the US add a scant 150,000 jobs in October, below the forecast of 180,000 addition and the collapse of September’s print of 297,000 (revised downward from 336,000) to the worst reading of the indicator since February 2021.
US data down: Risk appetite increases
Cooling US data is helping to confirm that the Federal Reserve (Fed) has ended rate hikes, and investors are now anticipating a future rate cut cycle by the US central bank. Markets expect monetary policy to make borrowing and lending cheaper again, so negative US economic data will continue to be positive for the market as recession factors will push the Fed to cut rates as soon as possible. before.
On Tuesday next week, the Reserve Bank of Australia (RBA) will announce its latest interest rate decision, and markets expect the Australian central bank to announce a 25 basis point hike as inflation continues. latent in the Australian economy.
AUD/USD Technical Outlook
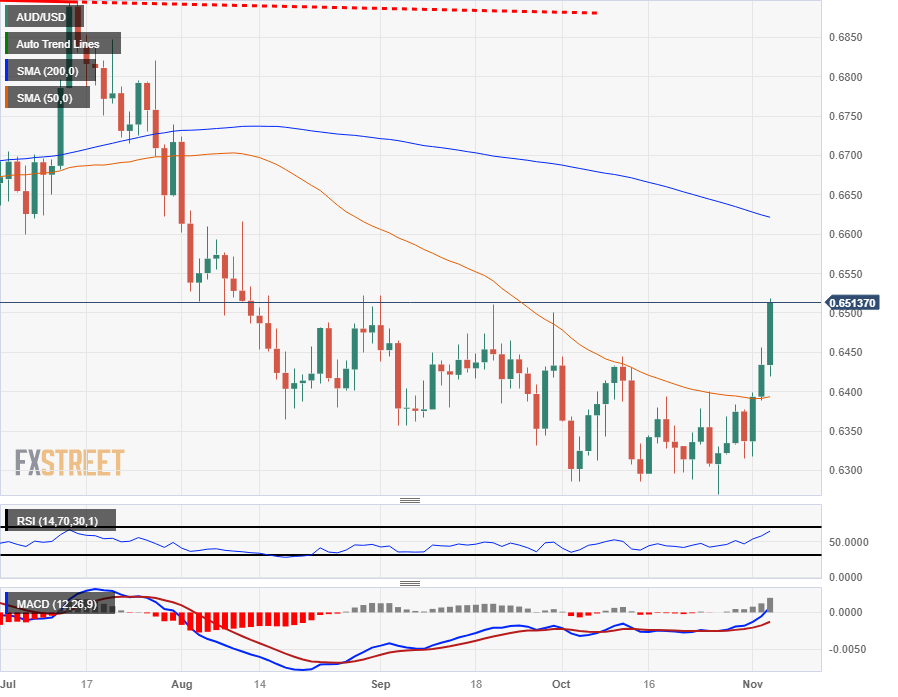
The Aussie’s technical recovery from October lows near the 0.6300 level has AUD/USD rising halfway towards the 200-day SMA that is currently turning lower at 0.6625.
With AUD/USD cleanly cutting the 50-day SMA near 0.6400, the pair is set to signal a bullish close on Friday near 0.6515.
AUD/USD Daily Chart
AUD/USD technical levels
Source: Fx Street
I am Joshua Winder, a senior-level journalist and editor at World Stock Market. I specialize in covering news related to the stock market and economic trends. With more than 8 years of experience in this field, I have become an expert in financial reporting.


