
- AUD/USD rebounds after US inflation came in higher than expected, but a weak jobs report slowed the dollar’s advance.
- US jobless claims rose to 258,000 as Fed officials suggested more easing, with the Atlanta Fed’s Bostic open to keeping rates steady.
- Australian economic focus shifts to next week’s labor market data and a speech from the RBA’s Sarah Hunter for more policy clues.
The Australian Dollar breaks five consecutive days of losses and rises more than 0.35% as data showed inflation in the United States (US) was higher than expected, but a weak jobs report moderated the advance of the Dollar. At the time of writing, AUD/USD is trading at 0.6738 and bounced from a daily low of 0.6699.
AUD/USD rises above 0.6700, breaking five-day losing streak
Wall Street ended Thursday’s session with losses after the US Bureau of Labor Statistics (BLS) revealed that the Consumer Price Index (CPI) rose 2.4% year-on-year, exceeding forecasts of 2, 3%, although below the 2.5% in August. The core CPI rose one tenth, from 3.2% the previous month, and as expected, was 3.3% year-on-year.
Other data showed that initial jobless claims for the week ending Oct. 5 were above the consensus of 230,000 and rose to 258,000, from 225,000 the previous week.
Federal Reserve officials appeared unfazed by the data and suggested that more easing is on the way – in the names of the New York Fed’s John Williams, the Richmond Fed’s Thomas Barkin and the Chicago Fed’s Austan Goolsbee. . However, Atlanta Fed President Raphael Bostic said he would be open to keeping rates unchanged at one of the last two meetings of the year.
On the Australian front, the agenda featured a speech by Sarah Hunter of the Reserve Bank of Australia (RBA), although she did not comment on monetary policy.
Next week, the Australian economic agenda will feature a speech from the RBA’s Sarah Hunter on Tuesday 15 October. For Wednesday, Australian employment data is expected to give some clues about the state of the labor market.
On the US front, Friday’s schedule will feature more speakers from the Fed, the release of the Producer Price Index (PPI) and Consumer Sentiment from the University of Michigan (UoM).
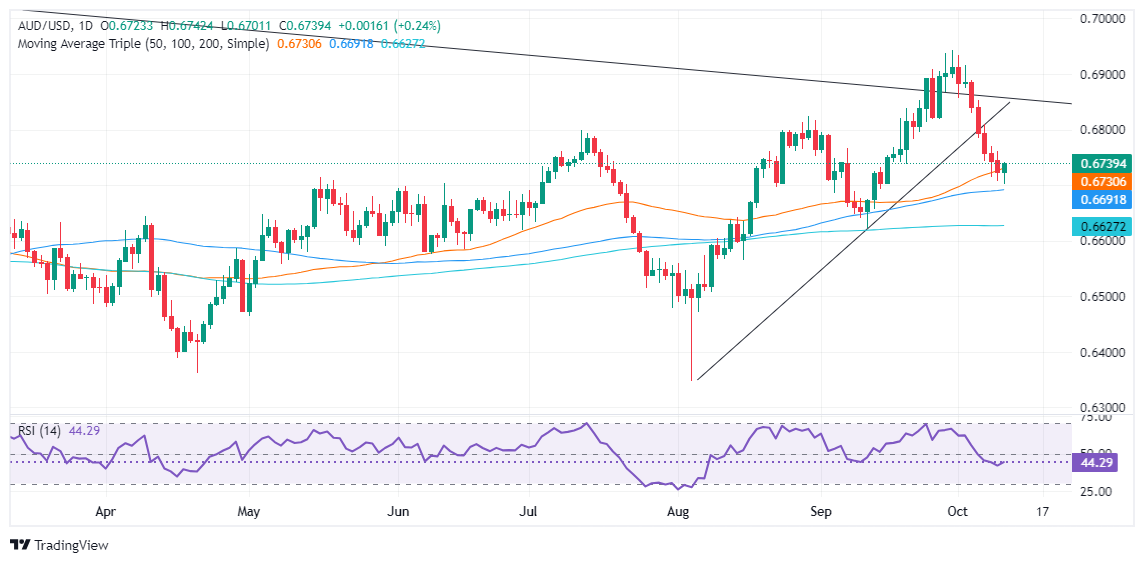
AUD/USD Price Forecast: Technical Outlook
From a technical point of view, AUD/USD is consolidating but tilted higher. For buyers to resume the uptrend, they must overcome the October 9 high at 0.6761 in order to challenge the weekly peak at 0.6809. On the contrary, if the sellers intervene and drag the exchange rate below the 50-day moving average (DMA) at 0.6733, it could pave the way for a fall towards the 100-day moving average (DMA) at 0.6691.
Australian Dollar PRICE Today
The table below shows the percentage change of the Australian Dollar (AUD) against major currencies today. Australian dollar was the strongest currency against the Japanese yen.
| USD | EUR | GBP | JPY | CAD | AUD | NZD | CHF | |
|---|---|---|---|---|---|---|---|---|
| USD | -0.02% | 0.01% | 0.03% | 0.02% | -0.04% | -0.01% | 0.00% | |
| EUR | 0.02% | -0.01% | 0.02% | 0.00% | 0.00% | -0.04% | -0.02% | |
| GBP | -0.01% | 0.01% | 0.02% | 0.00% | 0.00% | -0.03% | 0.00% | |
| JPY | -0.03% | -0.02% | -0.02% | -0.01% | -0.04% | -0.05% | -0.08% | |
| CAD | -0.02% | -0.01% | -0.01% | 0.00% | -0.02% | -0.03% | 0.00% | |
| AUD | 0.04% | 0.00% | 0.00% | 0.04% | 0.02% | -0.04% | -0.02% | |
| NZD | 0.01% | 0.04% | 0.03% | 0.05% | 0.03% | 0.04% | 0.04% | |
| CHF | -0.01% | 0.02% | -0.01% | 0.08% | -0.01% | 0.02% | -0.04% |
The heat map shows percentage changes for major currencies. The base currency is selected from the left column, while the quote currency is selected from the top row. For example, if you choose the Australian Dollar from the left column and move along the horizontal line to the US Dollar, the percentage change shown in the box will represent the AUD (base)/USD (quote).
Source: Fx Street
I am Joshua Winder, a senior-level journalist and editor at World Stock Market. I specialize in covering news related to the stock market and economic trends. With more than 8 years of experience in this field, I have become an expert in financial reporting.


