
- The US dollar rebounds on Monday after falling to seven-month lows against a basket of currencies.
- Australian inflation data could trigger a reaction from the Reserve Bank of Australia as prices continue to rise.
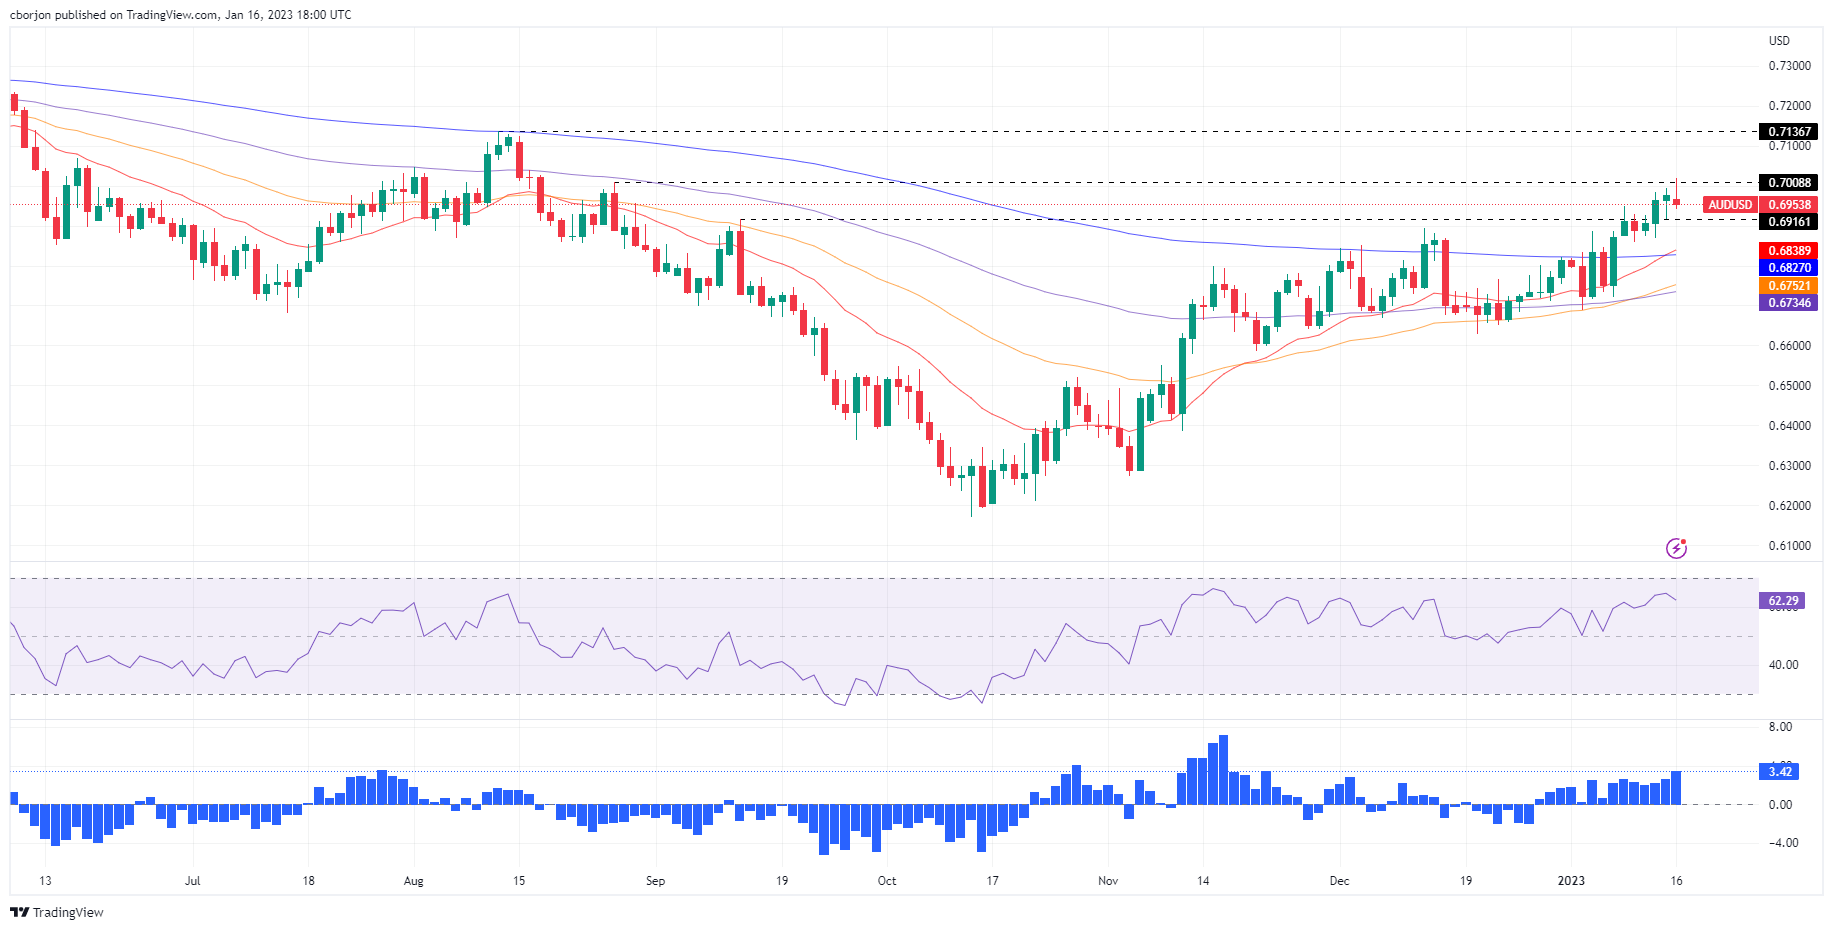
- AUD/USD Price Analysis: Reversing but expected to resume uptrend above 0.7000.
The Australian dollar (AUD) loses momentum against the US dollar (USD) and returns below 0.7000, due to low liquidity conditions, in the observance of Martin Luther King Jr. day. A risk aversion impulse strengthened the US dollar (USD), recovering some ground against most G8 currencies. Thus, the AUD/USD pair is trading at 0.6952.
Although the US stock market is closed, the SP500 and Nasdaq Futures reflect subdued market sentiment. Last week’s US economic data, mainly declining inflation and improving consumer confidence, according to the University of Michigan (UM) survey, raised speculation that the Federal Reserve of The US would tighten its monetary policy by 25 basis points. Furthermore, inflation expectations continue to decline as Americans remain optimistic that the US Central Bank can achieve a “soft landing”.
The Dollar Index (DXY), which measures the value of the USD against a basket of six currencies, is up nearly 0.70% to 128.730 despite the absence of US traders, putting a headwind for the AUD /USD.
On the Australian front, their economic calendar featured the Melbourne Institute’s monthly inflation gauge, which showed inflation slowing to 0.2%. The latest data showed that Australia’s inflation figures remained elevated, both in terms of quarterly and monthly readings. Australia’s annual inflation rate rose to a more than three-decade high of 7.3% in the third quarter of 2022, from 6.1% in the second. Meanwhile, monthly data showed Australia’s CPI rose to an all-time high of 7.3% yoy in November, well above the Reserve Bank of Australia’s (RBA) 2-3% target, fueling expectations for further tightening by the RBA.
AUD/USD Price Analysis: Technical Insights
After rallying for three straight days to hit fresh multi-month highs at 0.7019, the AUD/USD pair is pulling back to the 0.69-0.70 mid zone. Although in bullish territory, the Relative Strength Index (RSI) is pointing lower, unlike the Rate of Change (RoC), which shows that volatility is increasing. Therefore, AUD/USD traders may refrain from opening any new long positions until the RSI moves higher, although the path of least resistance is bullish.
Therefore, key AUD/USD resistance levels would be 0.7000, the fresh 7-month high reached on Jan 16 at 0.7019, and the daily high from Aug 11 at 0.7136.
Source: Fx Street
I am Joshua Winder, a senior-level journalist and editor at World Stock Market. I specialize in covering news related to the stock market and economic trends. With more than 8 years of experience in this field, I have become an expert in financial reporting.


