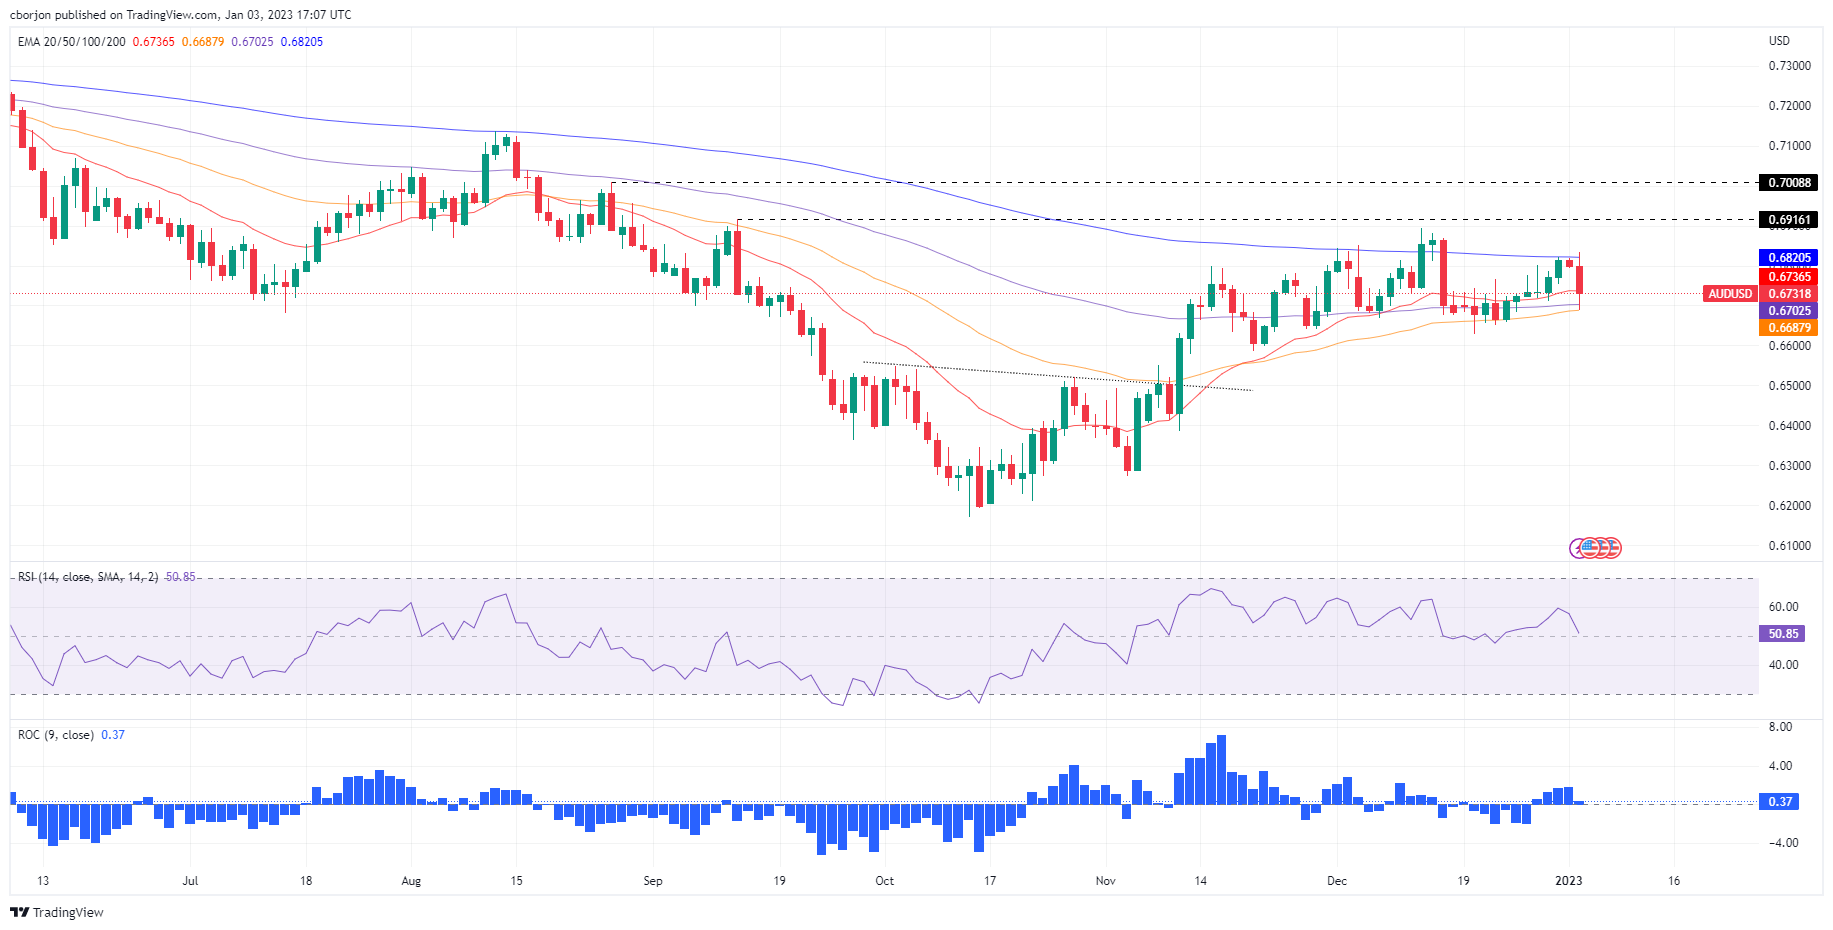
- AUD/USD dips below 0.6800 towards the 20-day EMA at 0.6736.
- The US dollar continues to rise, despite falling US bond yields, following the release of weak PMIs.
- Weak Chinese economic data dampened the outlook for the Australian dollar.
- AUD/USD Price Analysis: It is likely to stay within the 0.66/0.68 (200 pips) range limit.
The Australian dollar (AUD) slumps against the US Dollar (USD), while the AUD/USD pair fails to conquer the 200-day EMA, falling more than 60 points, or 0.99%, amid a session driven by US dollar strength. US dollar and negative sentiment. AUD/USD is trading at 0.6728, below its opening price, after reaching a daily high of 0.6834.
AUD/USD falls on strong US dollar
The start of 2023 has seen a comeback for the US dollar, which is appreciating against most G8 currencies. AUD/USD briefly pierced the 200 day EMA at 0.6820, but quickly reversed its previous gains and fell as sentiment soured, portrayed by Wall Street to the downside.
The first series of US economic data revealed that factory activity remained in contraction territory, as the US global manufacturing PMI for the final December reading was unchanged at 46.2. points. Siân Jones, Chief Economist at S&P Global Market Intelligence, said: “The manufacturing sector posted weak results at the end of 2022, as production and new orders contracted at faster rates. Demand for goods declined as the domestic orders and export sales. Weak demand also caused downward adjustments in portfolio values”.
Elsewhere, the dollar index (DXY), which measures the value of the dollar against a basket of six currencies, rose 1.12% to 104.653, hitting a new two-week high, hurting the outlook for rising prices. AUD/USD prices.
On the Australian side, weak data released over the weekend on China slightly weighed on the Australian dollar (AUD). China’s Manufacturing PMI, announced by the National Bureau of Statistics (NBS), continued its downward trend and stood at 47.0 from 48 in November. On the other hand, the Caixin PMI dipped to 49.0 in December, down from the previous reading of 49.4.
Looking ahead to the week, the US economic agenda continues to be loaded with the publication of the minutes of the last Federal Reserve (Fed) meeting, together with the ISM PMI manufacturing index for December. Australia’s economic calendar will reveal the Reserve Bank of Australia (RBA) charting package.
AUD/USD Price Analysis: Technical Perspective
From a daily chart perspective, the AUD/USD pair has continued to trade sideways since mid-November, trapped in a wide 0.6600/0.6800 range. It must be said that the inability of the AUD/USD to break out of the 200 day EMA suggests that the sellers are leaning towards it, which would pave the way for further losses. On the other hand, the bottom of the range, supported by the presence of the 20/50 and 100 day EMAs, would be difficult to break above. Thus, AUD/USD could continue to swing in the 0.66/0.68 200-point range.

AUD/USD
| Overview | |
|---|---|
| Last price today | 0.6729 |
| daily change today | -0.0076 |
| today’s daily variation | -1.12 |
| today’s daily opening | 0.6805 |
| Trends | |
|---|---|
| daily SMA20 | 0.6744 |
| daily SMA50 | 0.6655 |
| daily SMA100 | 0.664 |
| daily SMA200 | 0.686 |
| levels | |
|---|---|
| previous daily high | 0.6825 |
| previous daily low | 0.6793 |
| Previous Weekly High | 0.6821 |
| previous weekly low | 0.671 |
| Previous Monthly High | 0.6893 |
| Previous monthly minimum | 0.6629 |
| Fibonacci daily 38.2 | 0.6805 |
| Fibonacci 61.8% daily | 0.6813 |
| Daily Pivot Point S1 | 0.679 |
| Daily Pivot Point S2 | 0.6776 |
| Daily Pivot Point S3 | 0.6759 |
| Daily Pivot Point R1 | 0.6822 |
| Daily Pivot Point R2 | 0.6839 |
| Daily Pivot Point R3 | 0.6853 |
Source: Fx Street
I am Joshua Winder, a senior-level journalist and editor at World Stock Market. I specialize in covering news related to the stock market and economic trends. With more than 8 years of experience in this field, I have become an expert in financial reporting.


