
- The AUD/USD pair rises in a context of risk appetite in the markets.
- The Australian Dollar is up more than 2% from Tuesday’s low bids against the US Dollar.
- Unreleased US CPI data has boosted market sentiment.
The AUD/USD pair is on the rise this Tuesday, with a recovery of more than 2%, as market sentiment is firmly risk-on following the release of the US Consumer Price Index (CPI), which suggests that inflation in the US economy is receding faster than expected.
US CPI inflation failed to signal on Tuesday, coming in below expectations, raising market hopes that US inflation is receding more quickly than policymakers anticipated. If inflation falls faster and for longer than initially expected, it would open the door to a cycle of rate cuts by the Federal Reserve (Fed) sooner than expected.
Despite Tuesday’s recovery, the Australian dollar could struggle to hold on to higher levels for the rest of the week. Early on Tuesday, Westpac Australian Consumer Confidence for November stood at -2.6%, up from 2.9% in October.
The Australian Wage Price Index for the third quarter will be released on Wednesday and is forecast to rise from 0.8% to 1.3%. Later that same day, the Producer Price Index (PPI) and retail sales will land in the United States.
Year-on-year inflation is expected to remain at 2.7%, while month-on-month growth in Retail Sales will decline from 0.7% to -0.3%.
Quote of the Australian Dollar today
Below is the percentage change of the Australian Dollar (AUD) against the currencies listed today. The Australian Dollar was the strongest currency against the US Dollar.
| USD | EUR | GBP | CAD | AUD | JPY | NZD | CHF | |
| USD | -1.61% | -1.71% | -0.66% | -1.84% | -0.70% | -1.83% | -1.25% | |
| EUR | 1.58% | -0.10% | 0.93% | -0.21% | 0.91% | -0.22% | 0.36% | |
| GBP | 1.68% | 0.10% | 1.05% | -0.11% | 1.00% | -0.12% | 0.47% | |
| CAD | 0.63% | -0.97% | -1.05% | -1.16% | -0.07% | -1.19% | -0.56% | |
| AUD | 1.80% | 0.21% | 0.12% | 1.17% | 1.11% | 0.00% | 0.58% | |
| JPY | 0.68% | -0.91% | -1.00% | 0.02% | -1.11% | -1.10% | -0.55% | |
| NZD | 1.80% | 0.21% | 0.12% | 1.16% | 0.00% | 1.11% | 0.58% | |
| CHF | 1.23% | -0.37% | -0.46% | 0.58% | -0.58% | 0.55% | -0.58% |
The map shows the percentage changes of the major currencies against each other. The base currency is chosen in the left column, while the quote currency is chosen in the top row. For example, if you choose the euro in the left column and scroll down the horizontal line to the Japanese yen, the percentage change in the box will represent EUR (base)/JPY (quote).
AUD/USD Technical Outlook
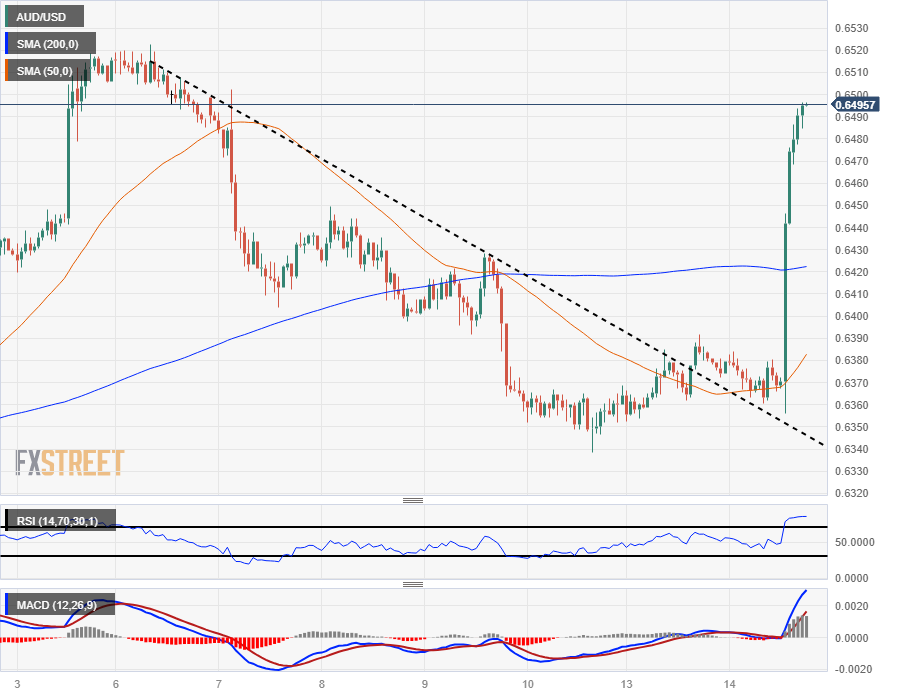
AUD/USD’s intraday recovery sees the pair paring last week’s declines, rebounding towards the 0.6500 area following widespread market reaction to the US CPI data.
The pair is up over 2% from Tuesday’s bid lows near 0.6355, with a firm rise from the 50-hour SMA to cleanly navigate through the 200-hour SMA, currently shaking just off north of 0.6420.
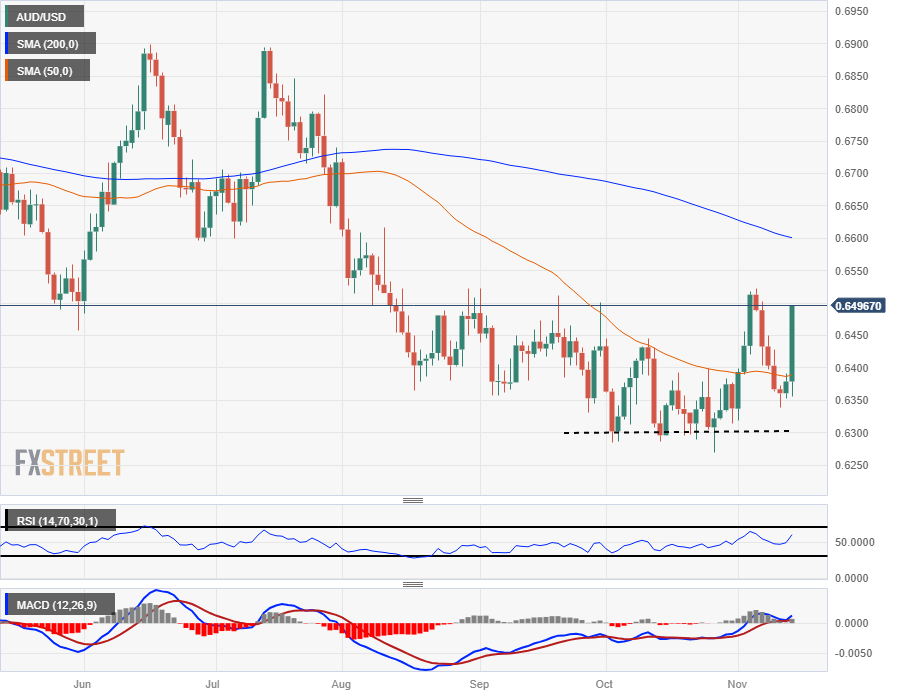
On the daily candlesticks, the Australian Dollar is experiencing one of its best days of trading against the US Dollar since July, and has reclaimed the middle of the range between the 50-day and 200-day SMA. The two moving averages have extended noticeably bearish, with the 50-day cutting back from just below the 0.6400 area, while the 200-day SMA turns lower at 0.660.
The AUD/USD, despite Tuesday’s gains extending a lift from the consolidation zone near 0.6300, remains bearish for the year, and is trading at a nearly 6% discount against the Dollar Bids June highs near 0.6900.
AUD/USD Hourly Chart
AUD/USD Daily Chart
AUD/USD technical levels
Source: Fx Street
I am Joshua Winder, a senior-level journalist and editor at World Stock Market. I specialize in covering news related to the stock market and economic trends. With more than 8 years of experience in this field, I have become an expert in financial reporting.


