
- AUDUSD is supported by the recovery after the US CPI and rises to its highest level since September 21.
- A slightly overbought RSI on the hourly charts could deter bulls from making aggressive bets.
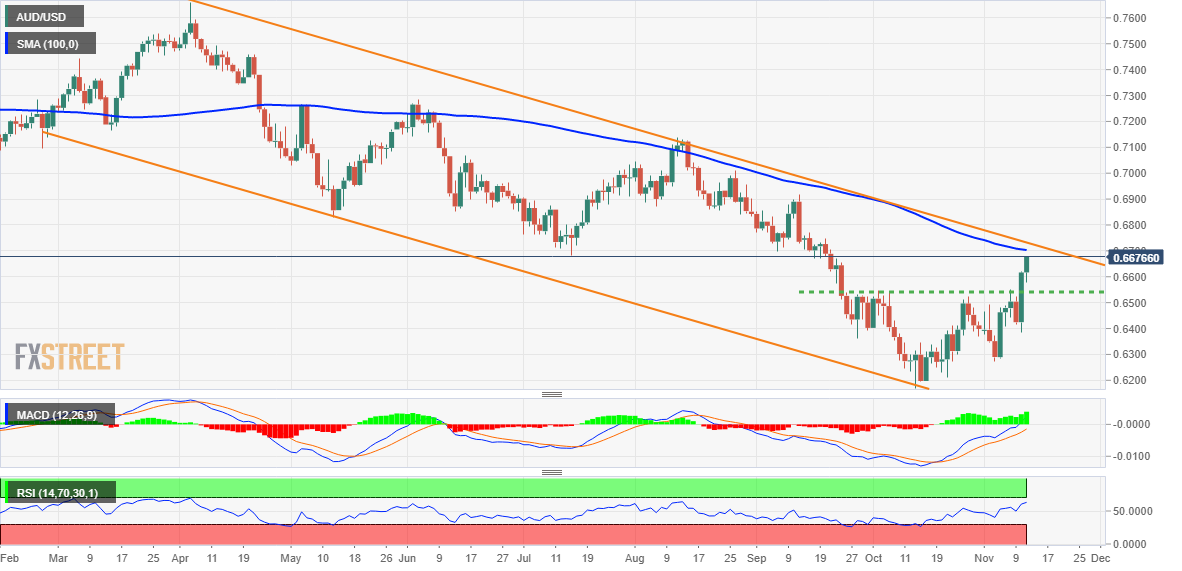
- A sustained break below the mid 0.6500 horizontal support will nullify the positive outlook.
The pair AUD/USD it is supported by the recovery in the US CPI, which was softer overnight, and gains traction for the second day in a row on Friday. The pair is holding on to its intraday gains throughout the early North American session and is currently hovering near the 0.6670-0.6680 region, or the highest level since September 21st.
Firm expectations that the Federal Reserve will slow the pace of its monetary policy tightening, amid signs of easing inflationary pressures, drag the US dollar to a 2-1/2-month low. Added to this, risk-on sentiment is seen as another factor undermining the safe-haven dollar, further benefiting the risk-sensitive Aussie. This, in turn, acts as a tailwind for the AUDUSD pair and continues to support the positive intraday move.
From a technical point of view, a slightly overbought RSI (14) on the hourly charts suggests that any further advance is likely to be capped near the 100-day SMA, currently around the 0.6700 round figure. Next is the 0.6740 barrier, which represents the upper end of a descending channel that runs from May 2022, and should act as a reference point for the AUDUSD pair. A convincing breakout will be seen as a new trigger for the bulls.
The pair could accelerate the momentum towards the recovery of the 0.6800 signal, above which the AUDUSD pair could test the next relevant hurdle near the 0.6850-0.6855 supply zone.
On the other hand, the 0.6640-0.6635 area seems to protect the immediate low ahead of the 0.6600 round figure and the daily low around the 0.6580-0.6575 area. Any further pullback is likely to attract further buying and remain capped near the 0.6545-0.6540 horizontal resistance breakout point. That said, some follow-on selling will negate the positive short-term outlook and spark some technical selling around the AUDUSD pair.
The next relevant support on the downside is set near the key psychological level 0.6500, below which spot prices would become vulnerable to test the 0.6440 support zone. The AUDUSD pair could end up going back to 0.6400. A bit of selling below the weekly low around the 0.6385 area will change the bias in favor of the bears.
AUDUSD daily chart
Key levels to watch
Source: Fx Street
With 6 years of experience, I bring to the table captivating and informative writing in the world news category. My expertise covers a range of industries, including tourism, technology, forex and stocks. From brief social media posts to in-depth articles, I am dedicated to creating compelling content for various platforms.


