
- AUDUSD soars more than 2% on Friday and is set to end the week with gains of 0.50%.
- The US Non-Farm Payrolls report beat estimates while the unemployment rate rose, weakening the dollar and strengthening the AUD.
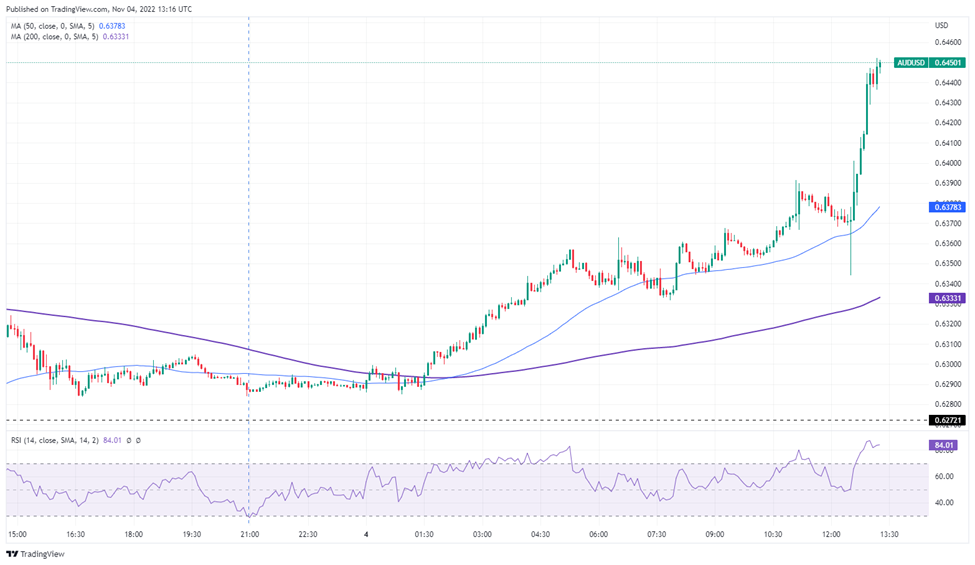
- AUDUSD Price Analysis: Gains 150 points and consolidates around 0.6440-50 as RSI enters overbought territory.
AUDUSD advances towards 0.6420 after the release of US employment data, which underlines the Fed’s concerns about the tight labor market, as the US economy added more jobs than expected, while average hourly earnings were unchanged at around 5% year-on-year, adding to inflationary pressures. At the time of writing, the AUDUSD is trading around 0.6440-55, having hit a daily low of 0.6285.
AUDUSD soared after the US Non-Farm Payrolls report.
On Friday, the US Department of Labor reported that the US economy added 261,000 jobs in October, shattering estimates of 193,000, justifying the need for greater aggressiveness from the Federal Reserve (Fed), although the rate of the federal funds (FFR) is already in the range of 3.75-4%. Although Fed Chairman Jerome Powell mentioned the Fed’s intention to slow the pace of rate hikes, he said the rate peak would be higher than the September Summary of Economic Projections (SEP) report. .
Digging a little deeper into the report, the Unemployment Rate rose 3.7%, surprised by a lower participation rate, while the Average Earning per Hour was unchanged at 4.7% YoY.
Market Reaction
AUDUSD tumbled after the headline release, as the 5min chart shows, towards 0.6344 and changed gears, rising aggressively, breaking above the psychological figure of 0.6400, and extending its gains towards the daily high around 0.6452. Relative Strength Index (RSI) is at 83 in overbought conditions, suggesting that AUDUSD could pull back before resuming its uptrend.
AUDUSD 5 minute chart
Source: Fx Street
With 6 years of experience, I bring to the table captivating and informative writing in the world news category. My expertise covers a range of industries, including tourism, technology, forex and stocks. From brief social media posts to in-depth articles, I am dedicated to creating compelling content for various platforms.


