
- Australian Dollar falls after CPI data release.
- Australia’s monthly CPI rose 3.8% year-on-year, moderating from 4.0% in May.
- The US dollar extends losses ahead of the Fed’s interest rate decision scheduled for Wednesday.
The Australian Dollar (AUD) is down against the US Dollar (USD) following the release of mixed Consumer Price Index (CPI) data on Wednesday, offering possible clues as to the future direction of monetary policy from the Reserve Bank of Australia (RBA).
This inflation report has raised expectations that the Reserve Bank of Australia (RBA) may choose to keep interest rates unchanged at its monetary policy meeting next week. However, economists have warned that further interest rate hikes could jeopardize Australia’s economic recovery.
Additionally, the NBS manufacturing PMI recorded a reading of 49.4 for July, slightly above the expected 49.3 but below the previous 49.5. Meanwhile, the non-manufacturing PMI came in at 50.2 as expected. Given that changes in the Chinese economy can significantly impact the Australian market, these PMI readings are particularly relevant.
The downside of the AUD/USD pair could be limited as the US Dollar (USD) faces challenges ahead of the Federal Reserve’s (Fed) next interest rate decision scheduled for Wednesday. The central bank is expected to keep rates unchanged in July, but there is growing anticipation of a rate cut in September. This speculation is putting pressure on the USD. Moreover, signs of cooling inflation and easing labor market conditions in the US are further fueling expectations of multiple rate cuts by the Fed this year, potentially totaling three cuts.
Daily Market Movers Roundup: Australian Dollar Falls on Risk Aversion
- The Australian Bureau of Statistics (ABS) reported that monthly CPI rose 3.8% in the year to June, moderating from 4% in May. Quarterly CPI rose 1% quarter-on-quarter and 3.8% year-on-year in the second quarter of the year. The RBA’s cut CPI, the central bank’s preferred indicator, rose 3.9% year-on-year in the second quarter, versus the expected and previous 4.0%.
- Australian building permits (mom) fell 6.5% in June, beating market expectations of a 3.0% decline. This follows a 5.7% increase in May. On a year-on-year basis, building permits declined 3.7%, compared with a 8.5% decline a year earlier.
- National Australia Bank (NAB) anticipates the Reserve Bank of Australia (RBA) cash rate to remain stable at 4.35% until May 2025, according to a recent report from NAB Economics. Looking ahead, the NAB Economics team predicts a decline to 3.6% by December 2025, with further declines expected in 2026.
- In a press release on Monday, the Australian Prudential Regulation Authority (APRA) warned that default rates are slowly increasing. Following its latest quarterly assessment of domestic and global economic conditions, APRA announced that it will keep macroprudential policy settings unchanged. These comments reflect its ongoing assessment of both domestic and global economic environments.
- Bank of America suggests that robust economic growth in the United States allows the Federal Open Market Committee (FOMC) to “afford to wait” before implementing any adjustments. BofA notes that the economy “remains strong” and expects the Fed to begin rate cuts in December.
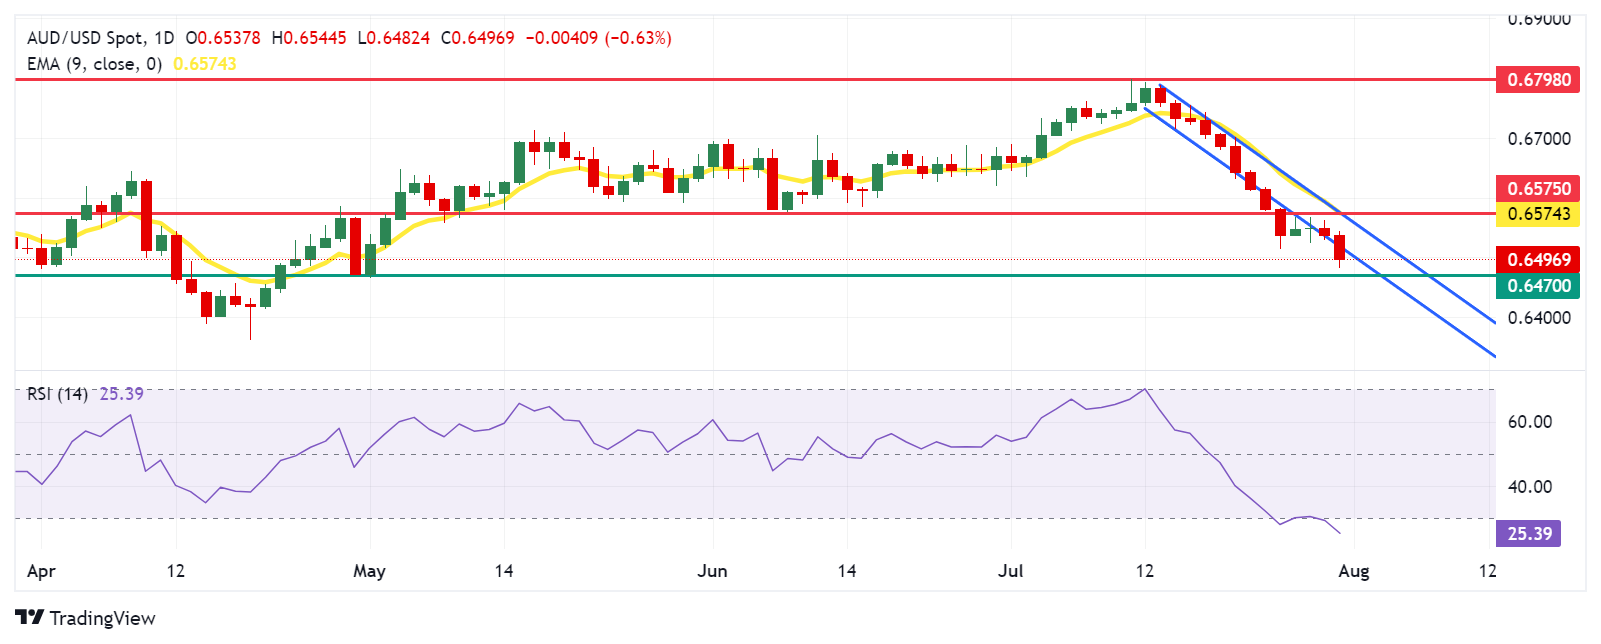
Technical Analysis: Australian Dollar falls near 0.6500
The Australian dollar is trading around 0.6500 on Wednesday. The daily chart analysis shows that the AUD/USD pair is breaking below a descending channel. The 14-day Relative Strength Index (RSI) is holding near the oversold level of 30, indicating a possible upward correction soon.
Immediate support for the AUD/USD pair is around the retracement support around the 0.6470 level.
On the upside, key resistance is around the “retracement support turned resistance” at 0.6575, aligned with the nine-day exponential moving average (EMA) at 0.6581. A break above this level could lead the AUD/USD pair to test the psychological level of 0.6600, with a potential target of a six-month high of 0.6798.
AUD/USD: Daily Chart
Australian Dollar PRICE Today
The table below shows the Australian Dollar (AUD) exchange rate against major currencies today. The Australian Dollar was the weakest currency against the Japanese Yen.
| USD | EUR | GBP | JPY | CAD | AUD | NZD | CHF | |
|---|---|---|---|---|---|---|---|---|
| USD | -0.07% | -0.06% | -0.23% | -0.03% | 0.59% | -0.13% | -0.10% | |
| EUR | 0.07% | 0.04% | -0.13% | 0.04% | 0.66% | -0.04% | -0.02% | |
| GBP | 0.06% | -0.04% | -0.20% | 0.00% | 0.61% | -0.08% | -0.05% | |
| JPY | 0.23% | 0.13% | 0.20% | 0.25% | 0.81% | 0.09% | 0.16% | |
| CAD | 0.03% | -0.04% | -0.00% | -0.25% | 0.60% | -0.11% | -0.08% | |
| AUD | -0.59% | -0.66% | -0.61% | -0.81% | -0.60% | -0.70% | -0.68% | |
| NZD | 0.13% | 0.04% | 0.08% | -0.09% | 0.11% | 0.70% | 0.03% | |
| CHF | 0.10% | 0.02% | 0.05% | -0.16% | 0.08% | 0.68% | -0.03% |
The heatmap shows percentage changes of major currencies. The base currency is selected from the left column, while the quote currency is selected from the top row. For example, if you choose the Australian Dollar from the left column and move along the horizontal line to the US Dollar, the percentage change shown in the chart will represent the AUD (base)/USD (quote).
Inflation FAQs
Inflation measures the rise in prices of a representative basket of goods and services. Headline inflation is usually expressed as a percentage change month-on-month and year-on-year. Core inflation excludes more volatile items such as food and fuel, which can fluctuate due to geopolitical and seasonal factors. Core inflation is the figure that economists focus on and is the target level for central banks, which are mandated to keep inflation at a manageable level, usually around 2%.
The Consumer Price Index (CPI) measures the change in prices of a basket of goods and services over a period of time. It is usually expressed as a percentage change month-on-month and year-on-year. The core CPI is the target for central banks as it excludes the volatility of food and fuel. When the core CPI exceeds 2%, interest rates typically rise, and vice versa when it falls below 2%. Since higher interest rates are positive for a currency, higher inflation usually translates into a stronger currency. The opposite is true when inflation falls.
Although it may seem counterintuitive, high inflation in a country drives up the value of its currency and vice versa in the case of lower inflation. This is because the central bank will typically raise interest rates to combat higher inflation, which attracts more global capital inflows from investors looking for a lucrative place to park their money.
Gold was once the go-to asset for investors during times of high inflation because it preserved its value, and while investors often still buy Gold for its safe haven properties during times of extreme market turmoil, this is not the case most of the time. This is because when inflation is high, central banks raise interest rates to combat it. Higher interest rates are negative for Gold because they increase the opportunity cost of holding Gold versus an interest-bearing asset or putting the money in a cash deposit account. Conversely, lower inflation tends to be positive for Gold as it lowers interest rates, making the shiny metal a more viable investment alternative.
Source: Fx Street
I am Joshua Winder, a senior-level journalist and editor at World Stock Market. I specialize in covering news related to the stock market and economic trends. With more than 8 years of experience in this field, I have become an expert in financial reporting.


