
- The Australian dollar trimmed losses after the release of China’s manufacturing PMI, which beat expectations.
- Australia’s manufacturing PMI fell for a fifth consecutive month to 47.2 in June.
- The US Dollar retreats as recent inflation data increases the likelihood of Fed rate cuts in 2024.
The Australian Dollar (AUD) remains firm as China’s Caixin Manufacturing PMI rose to 51.8 in June, defying expectations of a fall to 51.2 from 51.7 in May. Any changes to the Chinese economy could impact the Australian market, as both nations are close trading partners.
The AUD came under pressure as investor sentiment deteriorated following data indicating that Australia’s manufacturing PMI in June contracted at its fastest pace since May 2020. The market’s focus now turns to the upcoming AUD minutes. Reserve Bank of Australia (RBA) monetary policy meeting on Tuesday to obtain information on the direction of monetary policy.
The US Dollar (USD) depreciates on rising expectations that the US Federal Reserve (Fed) will cut interest rates in 2024. The CME FedWatch tool indicates the likelihood of a Fed rate cut in December from 25 basis points has increased to almost 32.0%, compared to 28.7% a week earlier.
Daily Market Summary: Australian Dollar Holds Ground After Stronger China PMI
- Judo Bank Australia Manufacturing PMI fell for the fifth consecutive month to 47.2 in June from 49.7 in May. This drop is the fastest deterioration since May 2020.
- Australian 10-year government bond yields rose above 4.4% as a high inflation reading fueled fears the Reserve Bank of Australia could raise interest rates again at its next meeting in August.
- The NBS China Manufacturing PMI remained at 49.5 in June, consistent with market forecasts and marking the second consecutive month at this level. This result indicates the fourth instance of contraction. Meanwhile, the non-manufacturing PMI fell to 50.5 from the previous reading of 51.1, below market expectations of 51.0. Despite marking the 18th consecutive month of expansion in the services sector, this is the slowest pace of growth since last December.
- On Friday, the US Bureau of Economic Analysis reported that US inflation slowed to its lowest annual rate in more than three years. The US Personal Consumption Expenditure (PCE) Price Index rose 2.6% year-on-year in May, up from 2.7% in April, meeting market expectations. Core PCE inflation also rose 2.6% year-on-year in May, up from 2.8% in April, in line with estimates.
- Reserve Bank of Australia (RBA) deputy governor Andrew Hauser said it would be a “serious mistake” to formulate policy in response to a single inflation report. He emphasized that there is still a set of economic data to come that will require detailed analysis, according to Bloomberg.
- Last week, the Australian Bureau of Statistics showed that the monthly Consumer Price Index (CPI) rose by 4.0% in the year to May 2024, up from 3.6% in April and beating market forecasts of 3.8%. This is the highest level since November 2023.
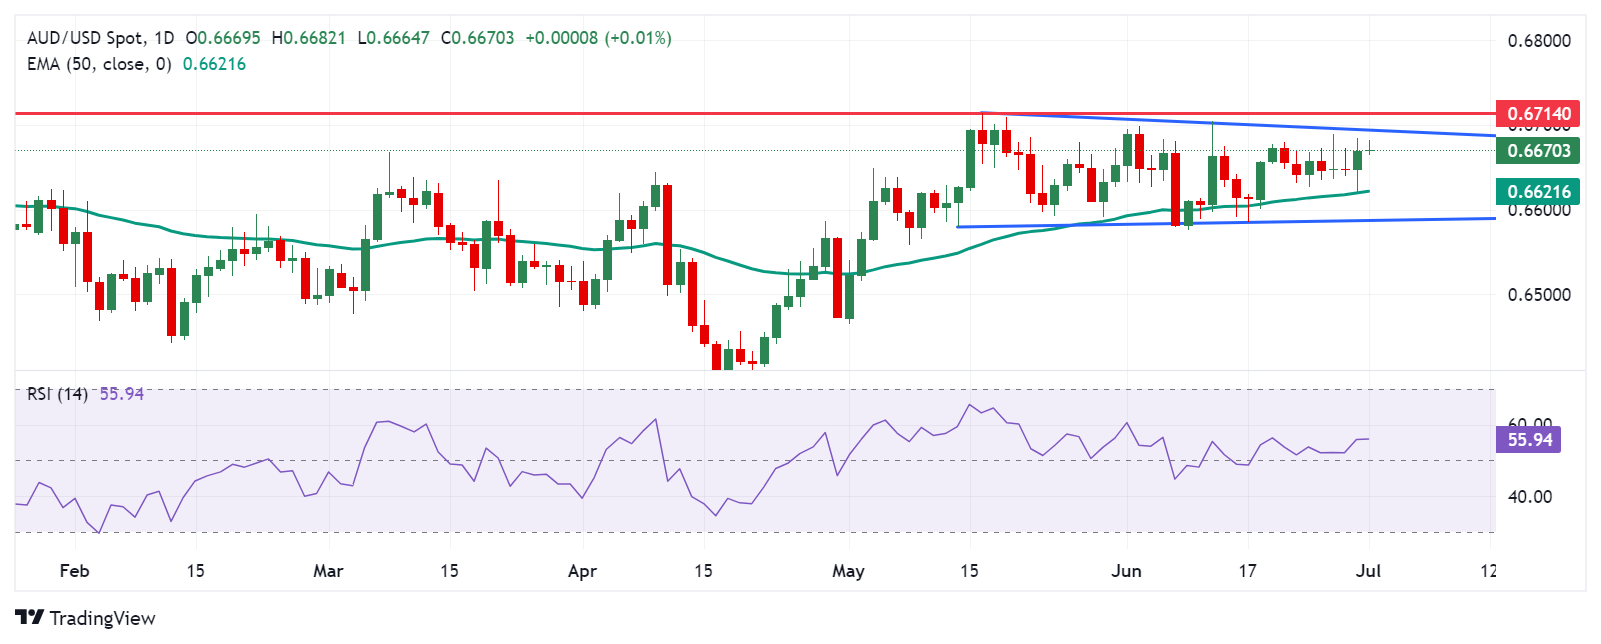
Technical Analysis: The Australian Dollar declines towards 0.6650
The Australian Dollar is trading around 0.6670 on Monday. Daily chart analysis indicates a neutral bias for the AUD/USD pair as it consolidates within a rectangular formation. The 14-day Relative Strength Index (RSI) is positioned slightly above the 50 level, suggesting a potential bullish bias.
The AUD/USD pair could find resistance near the upper boundary of the rectangle formation around 0.6690, followed by the psychological level of 0.6700. Additional resistance is seen at 0.6714, the highest level since January.
On the downside, the AUD/USD pair finds support around the 50-day EMA at 0.6621. A break below this level could lead the pair to test the lower boundary of the rectangular formation near 0.6585.
AUD/USD: Daily Chart
Australian Dollar PRICE Today
The table below shows the Australian Dollar (AUD) exchange rate against major currencies today. The Australian Dollar was the strongest currency against the Japanese Yen.
| USD | EUR | GBP | JPY | CAD | AUD | NZD | CHF | |
|---|---|---|---|---|---|---|---|---|
| USD | -0.32% | -0.09% | 0.11% | 0.01% | 0.00% | -0.05% | 0.10% | |
| EUR | 0.32% | -0.00% | 0.14% | 0.03% | 0.21% | -0.03% | 0.12% | |
| GBP | 0.09% | 0.00% | 0.12% | 0.04% | 0.22% | -0.03% | 0.12% | |
| JPY | -0.11% | -0.14% | -0.12% | -0.12% | -0.06% | -0.16% | 0.01% | |
| CAD | -0.01% | -0.03% | -0.04% | 0.12% | 0.03% | -0.07% | 0.09% | |
| AUD | -0.00% | -0.21% | -0.22% | 0.06% | -0.03% | -0.23% | -0.01% | |
| NZD | 0.05% | 0.03% | 0.03% | 0.16% | 0.07% | 0.23% | 0.17% | |
| CHF | -0.10% | -0.12% | -0.12% | -0.01% | -0.09% | 0.01% | -0.17% |
The heat map shows percentage changes for major currencies. The base currency is selected from the left column, while the quote currency is selected from the top row. For example, if you choose the Australian Dollar from the left column and move along the horizontal line to the US Dollar, the percentage change shown in the box will represent the AUD (base)/USD (quote).
Australian Dollar FAQs
One of the most important factors for the Australian Dollar (AUD) is the level of interest rates set by the Reserve Bank of Australia (RBA). Since Australia is a resource-rich country, another key factor is the price of its largest export, iron ore. The health of the Chinese economy, its largest trading partner, is a factor, as is inflation in Australia, its growth rate and the Trade Balance. Market sentiment, i.e. whether investors are betting on riskier assets (risk-on) or seeking safe havens (risk-off), is also a factor, with risk-on being positive for the AUD.
The Reserve Bank of Australia (RBA) influences the Australian Dollar (AUD) by setting the level of interest rates that Australian banks can lend to each other. This influences the level of interest rates in the economy as a whole. The RBA’s main objective is to maintain a stable inflation rate of 2%-3% by adjusting interest rates up or down. Relatively high interest rates compared to other major central banks support the AUD, and the opposite for relatively low ones. The RBA can also use quantitative easing and tightening to influence credit conditions, with the former being negative for the AUD and the latter positive for the AUD.
China is Australia’s largest trading partner, so the health of the Chinese economy greatly influences the value of the Australian Dollar (AUD). When the Chinese economy is doing well, it buys more raw materials, goods and services from Australia, which increases demand for the AUD and drives up its value. The opposite occurs when the Chinese economy does not grow as fast as expected. Therefore, positive or negative surprises in Chinese growth data usually have a direct impact on the Australian Dollar.
Iron ore is Australia’s largest export, with $118 billion a year according to 2021 data, with China being its main destination. The iron ore price, therefore, may be a driver of the Australian dollar. Typically, if the price of iron ore rises, the AUD also rises as aggregate demand for the currency increases. The opposite occurs when the price of iron ore falls. Higher iron ore prices also tend to result in a higher likelihood of a positive trade balance for Australia, which is also positive for the AUD.
The trade balance, which is the difference between what a country earns from its exports and what it pays for its imports, is another factor that can influence the value of the Australian dollar. If Australia produces highly sought-after exports, its currency will gain value solely from the excess demand created by foreign buyers wanting to purchase its exports versus what it spends on purchasing imports. Therefore, a positive net trade balance strengthens the AUD, with the opposite effect if the trade balance is negative.
Source: Fx Street
I am Joshua Winder, a senior-level journalist and editor at World Stock Market. I specialize in covering news related to the stock market and economic trends. With more than 8 years of experience in this field, I have become an expert in financial reporting.


