The price of bitcoin (BTC) is faced with difficulties due to sales pressure. During the week, BTC decreased by 3%. Over the past 24 hours, the increase has amounted to only 0.3%, and there are almost no changes on the hourly schedule.
Such dynamics in the narrow range reflects the struggle between buyers and sellers. However, onchain-data show an encouraging attribute that can determine the next step.
Streams on exchanges show 10 days of pressure
One way to track pressure is clean streams on exchanges. Positive flows mean that more coins are entered on exchanges, which often indicates sales. The outfills mean that the coins leave the exchanges, which usually signals purchases.
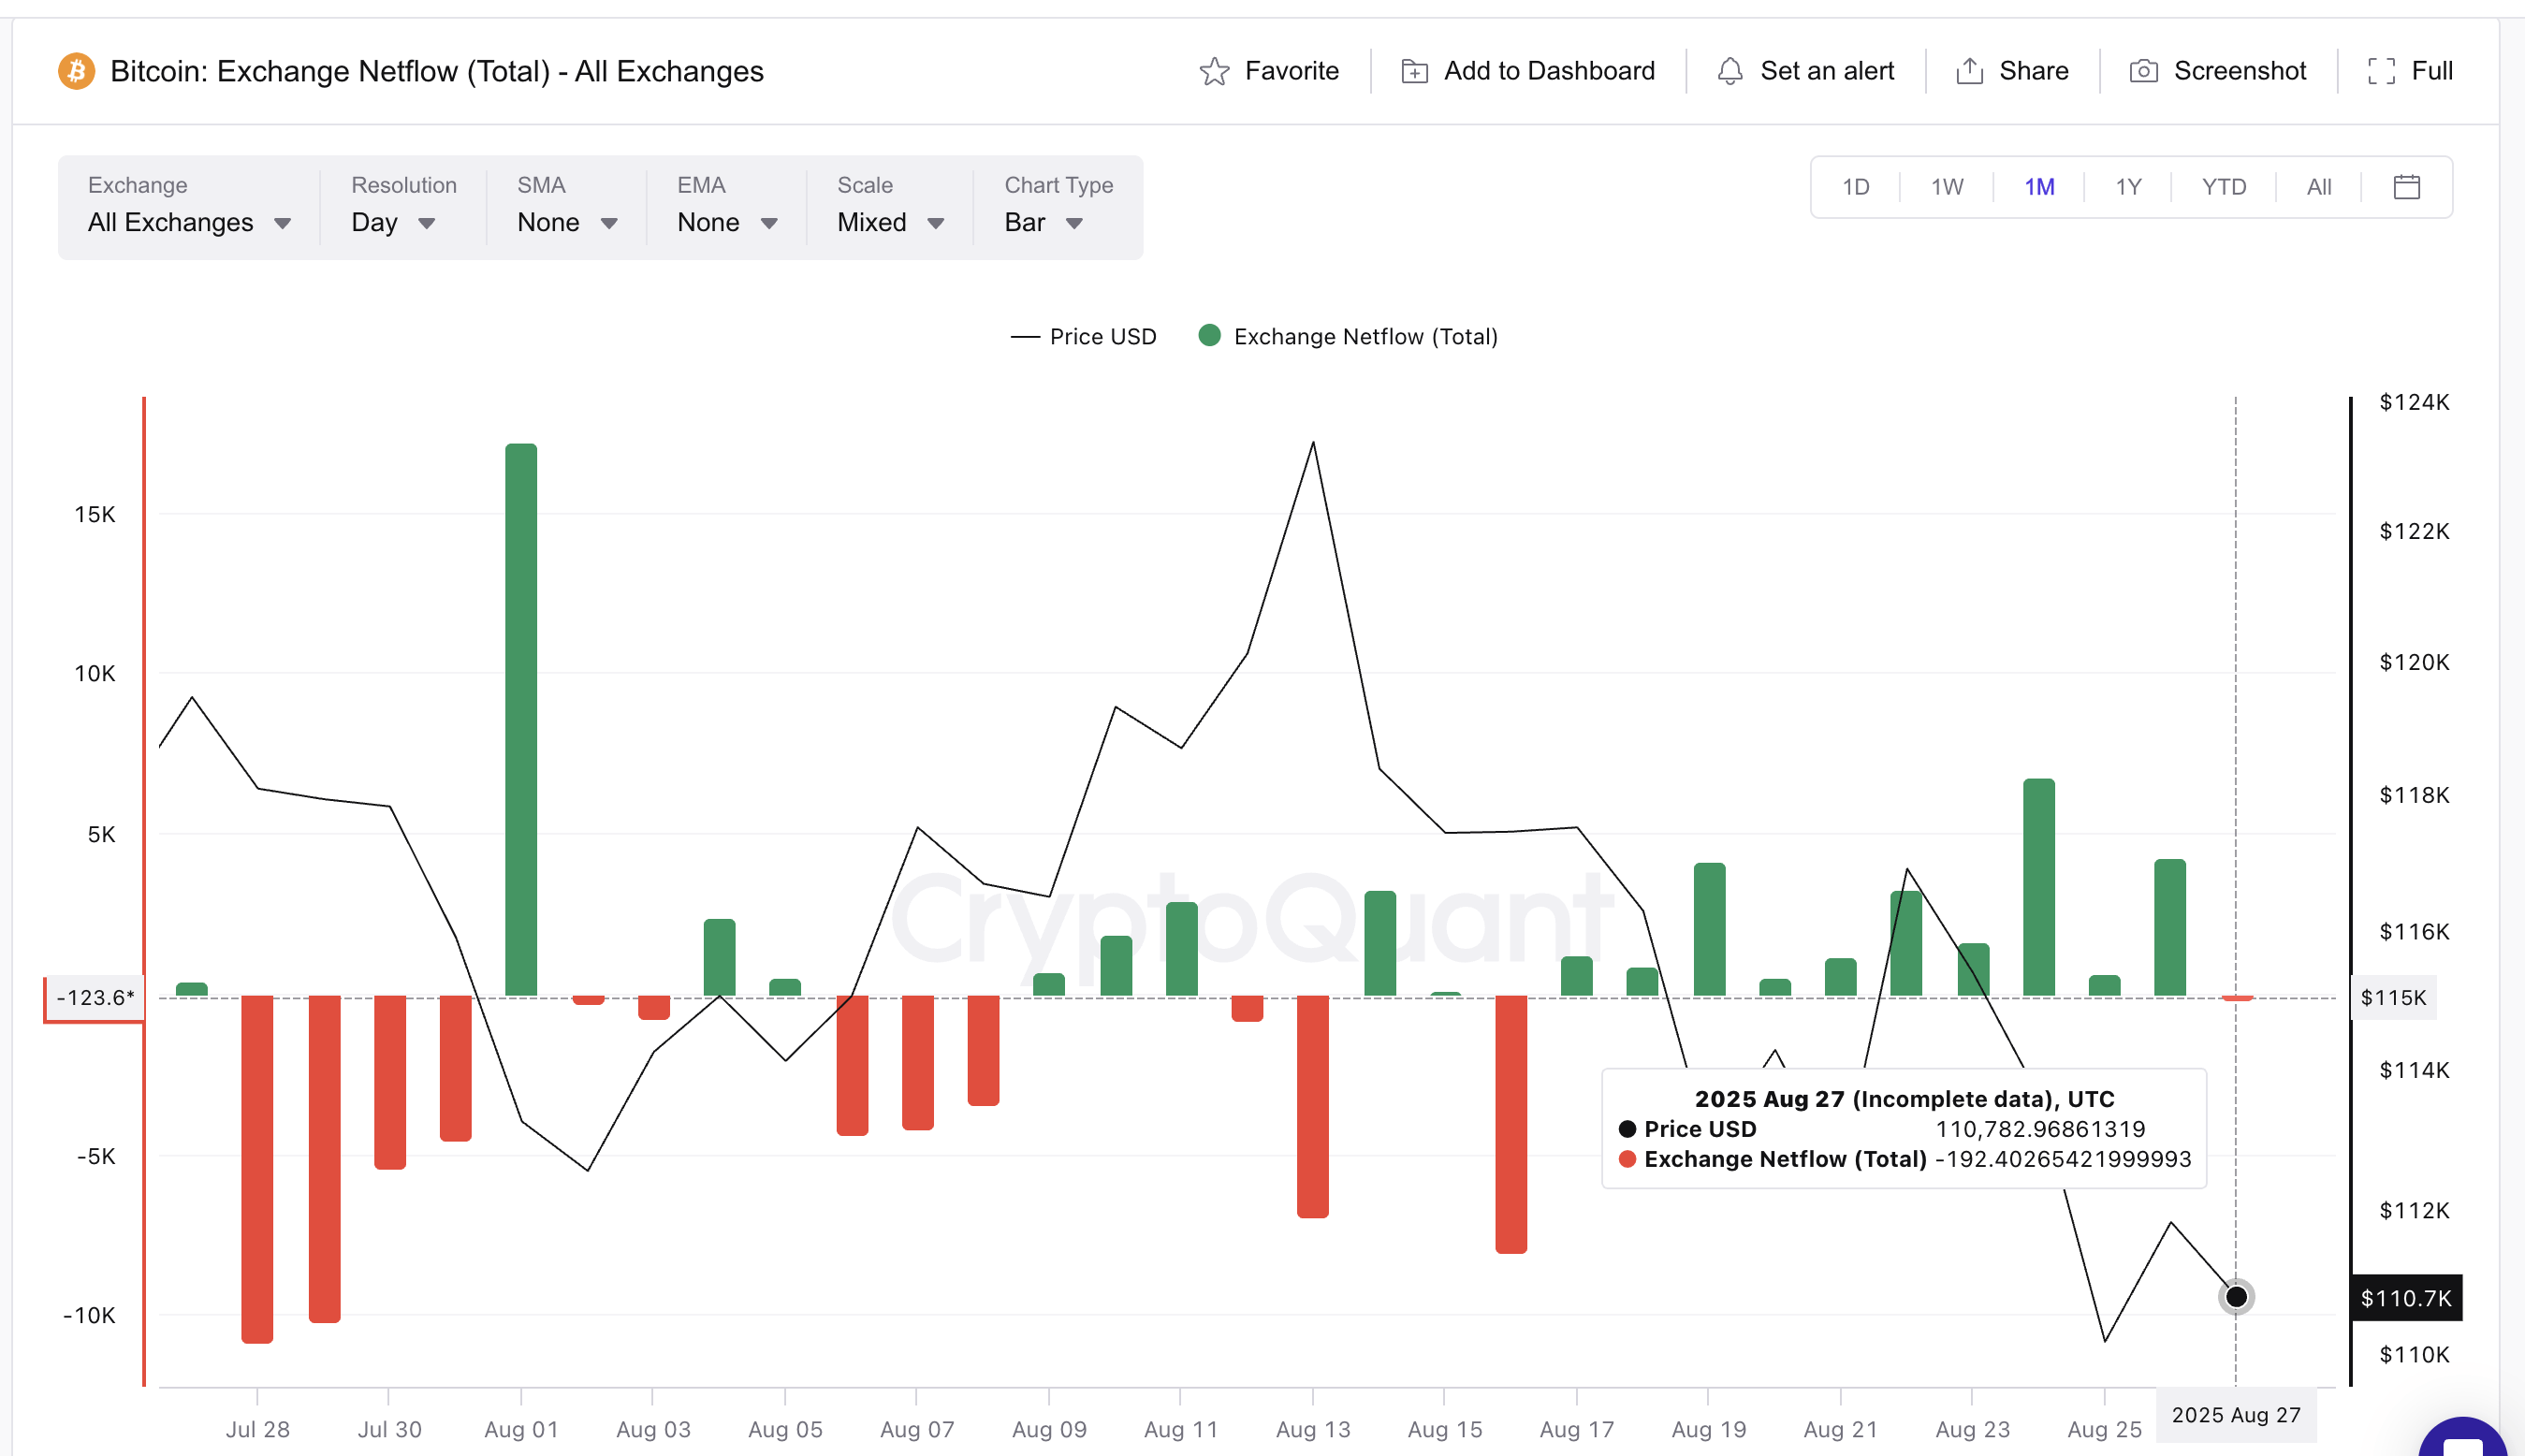
Streams of bitcoin on exchanges remained stable 10 sessions in a row. On August 24, they reached a peak of 6 775 BTC, which has become one of the largest daytime indicators in recent months. Even after that, the flows remained high – on August 26, the value still exceeded 4,239 BTC.

For the first time in 10 days, the situation has changed. Pure flows have become negative, at –192 BTC. This shows that sellers may begin to lose control, albeit slightly.
At the time of publication, buyers are trying to take control, but the result is not yet clear. If the tributaries increase again, the series can last until the 11th day, and the sales scenario will remain relevant.
NUPL short -term holders gives a glimpse of hope
An encouraging signal comes from short -term holders – investors who own bitcoin less than 155 days. Their activity is monitored using the NUPL metric (clean unrealized profit/loss), which shows how much profit or loss they have compared to the moment of purchase.
The NUPL indicator for short -term holders fell by almost 90% in just 40 days. It decreased from 0.152 in mid -July to 0.012 by August 25, which became the lowest level of three months. Since then, it has grown a little to 0.026, but still remains close to a minimum.
Each time NUPL short -term holders fell to such low levels, the price of bitcoin was restored. On the fifth of June, when the value reached 0.04, the price of bitcoin increased from $ 101,626 to more than $ 110,000. June 22, with a value of 0.02, prices again began to rise shortly after. The second of August, when the indicator reached 0.05, Bitcoin jumped from $ 112,571 to $ 123,345.
Now the situation is repeated. If the pattern is preserved, this can be the beginning of a new growth in bitcoin price.
Bitcoin prices, which should be followed
The price of bitcoin at the time of writing ranges between $ 108,600 and $ 112,300. This narrow range shows how balanced the struggle between buyers and sellers is.
If sellers increase pressure and tributaries increase the 11th day in a row, bitcoin can break through the level of $ 108,600, which will lead to deeper losses.
However, if buyers hold the current small outflow and NUPL patterns will be repeated, the first goal will be confident closure above $ 112,300. After that, bitcoin can rise to $ 116,500, and then to $ 118,400, which will become levels that must be overcome for more significant growth.
Now Bitcoin is stuck between sales pressure and an encouraging signal from short -term holders. If the influx of funds stops, the bulls will have a chance for growth. Otherwise, a new decline is possible.
Be in the know! Subscribe to Telegram.
Source: Cryptocurrency
I am an experienced journalist and writer with a career in the news industry. My focus is on covering Top News stories for World Stock Market, where I provide comprehensive analysis and commentary on markets around the world. I have expertise in writing both long-form articles and shorter pieces that deliver timely, relevant updates to readers.


