What is stochastic
Stochastic (from English stochastic) is one of the oscillators that are used to analyze price movements on the crypto market. It shows how the current price of an asset compares to the past price range over a given period of time. Like all other oscillators, stochastic is mainly used to determine entry and exit points for an asset. How is it calculated?
Stochastic calculation
The indicator consists of two lines: % K and % D. The first represents fast stochastic, and the second slow. To calculate % K, you need to know the closing price of the current period, as well as the high and low for the selected period of time. Then it is necessary to calculate the ratio of the difference between the current price and the minimum price in a given area to the difference in the maximum and minimum prices in a given area. Then multiply the result by 100%.
Sounds a bit complicated? Let’s look at a clear example.
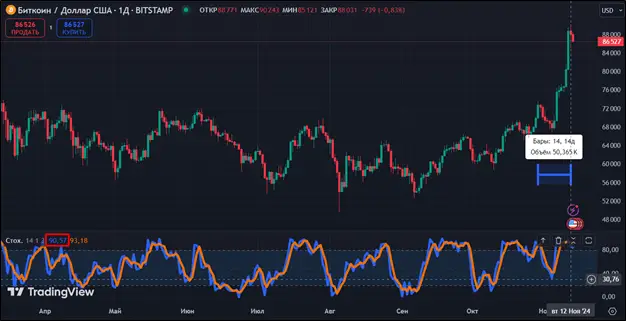
Let’s use Bitcoin data from the Bitstamp exchange. We will make the calculation for the date November 12, 2024. Let’s take the given period to be 14 days. Let’s take the current price of BTC for November 12 equal to the closing price – $88,031. The maximum for two weeks was $90,243, and the minimum = $66,798. We calculate the slow stochastic:
% K = ($88,031 – $66,798) / ($90,243 – $66,798) * 100% = $21,233/$23,445 * 100% = 90.57%.
The accuracy of the calculation can be compared with the machine data, which is shown in the figure below and marked with a red rectangle. As can be seen from the illustration, the data is identical. The %K line itself is shown in blue:
Source: tradingview.com
%D is simply a moving average of %K over a period. In the figure above it is three days. %D is indicated by an orange line. It is worth noting that various moving averages can be used to calculate fast stochastics: simple, weighted or exponential.
How to use the indicator when trading?
Application of stochastic
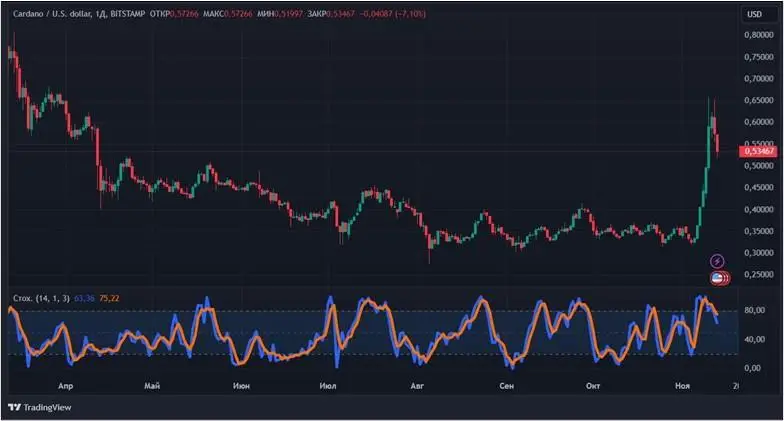
The easiest way is to use stochastics to determine oversold and overbought cryptocurrencies. The first is observed below the level of 20%, and the second above 80%. You need to buy when the stochastic lines cross the 20% mark from bottom to top. You should sell when the indicator crosses the 80% border from top to bottom.
For example, if you look at the current situation in Cardano, the stochastic is giving sell signals. This is due to the fact that both %K and %D crossed the 80% mark from top to bottom, thus leaving the overbought zone.
Source: tradingview.com
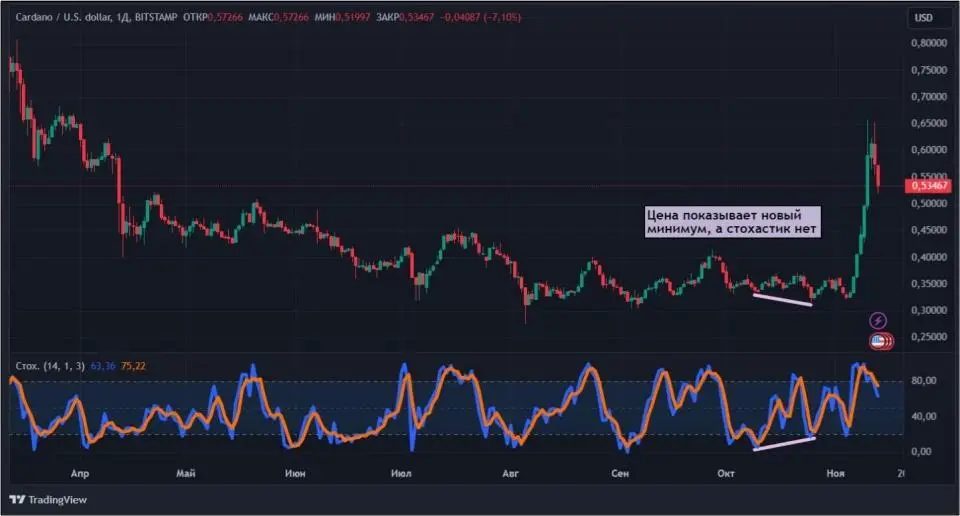
Like many other oscillators such as the RSI, the stochastic is a strong signal divergence And convergence. The first is observed when the price shows a new high or low, but the indicator does not. Divergence is a strong reversal signal. Convergence – the unidirectional movement of the price of a cryptocurrency and an indicator is interpreted as a continuation of the current trend.
Let’s look at the same Cardano chart. If we look at how the cryptocurrency was traded in October, we will see: the price minimum was reached on the 25th. But the stochastic showed higher values that day than on October 10. Thus, the price showed a new low, but the indicator did not. There was a bullish divergence on the face. As can be seen from the chart, since the beginning of November the price has turned upward.
Source: tradingview.com
It is worth noting: if divergence occurs in overbought/oversold zones, then the signal strengthens. In fact, this is exactly what happened with Cardano in October.
A number of speculators use the crossing of the % K 50% line as a signal. Trading based on it is quite risky, especially with cryptocurrencies, the price movements of which can be significant. Again, going back to the Cardano chart, using the 50% crossover signal would have produced less profit than the same bullish divergence.
Some traders use the direct intersection of the % K and % D lines. The interpretation here is similar to conventional moving averages. If %K crosses %D from bottom to top, then you should buy, and if from top to bottom, then sell. The signal also strengthens in overbought and oversold zones. If you rely on it now in the case of Cardano, then you need to sell.
So, can stochastics be used in trading as the only signal sensor? Or is that not true?
Stochastic and other signals
Stochastic is a common indicator. It does not give 100% profit. Therefore, it must be used in combination with other tools. They can be other technical indicators like RSI or moving averages or fundamental factors: political, economic news. It is also worth remembering that stochastic works better if the cryptocurrency is trending. But when moving sideways, it will give many false signals.
Who introduced the indicator into practice and when?
Creator of Stochastic
Stochastic was introduced by trader George Lane in the late 1950s. Although there were no cryptocurrencies in those days, this does not prevent modern analysts and crypto enthusiasts from using the indicator for trading Bitcoin and altcoins.
Conclusion
Thus, stochastic is a fairly convenient indicator for determining when to buy or sell a crypto asset. It is best suited for trading the market when there is a trend. The indicator will soon celebrate its 70th anniversary.
Source: Bits
I am an experienced journalist, writer, and editor with a passion for finance and business news. I have been working in the journalism field for over 6 years, covering a variety of topics from finance to technology. As an author at World Stock Market, I specialize in finance business-related topics.


