What are Bollinger Bands
Bands (ribbons, lines) Bollinger (Bollinger Bands or BB) is an indicator of technical analysis, which is aimed at determining the trend of a particular cryptocurrency, as well as measuring its volatility. The term was introduced into practice by John A. Bollinger in the late 1980s and early 1990s.
Purely visually, Bollinger Bands represent a channel that expands or contracts depending on the change in the price of a particular cryptocurrency. It is the width of the channel that is a reflection of the volatility that is present at a particular moment in the market.
How to build Bollinger Bands?
Building Bollinger Bands
The indicator consists of three lines. Average = nothing but a normal moving average. So it was originally set by the creator. In some terminals, it is possible to replace it with an exponential (EMA) or weighted (WMA) moving average. At the same time, the effectiveness of the replacement is quite controversial.
Since we have a moving average, it needs a period for which it will be calculated. Bollinger used a 20-day interval, which is set by default in the settings. And then everyone can experiment and set at least a smaller, at least a longer period of time. It all depends on your trading style and the specific cryptocurrency you are trading.
The upper and lower lines are the same moving average, just shifted by a few standard deviations. Bollinger used a parameter equal to 2. True, he wrote this in relation to the stock market: in the 80s and early 90s there were no cryptocurrencies yet. Perhaps, given the volatility, three or five standard deviations are more appropriate for digital assets. Again, everything is individual.
There is no point in manually calculating moving averages and standard deviations. In any, even the most common, trading terminal, this is done automatically. You just have to set the parameters necessary for your trading system.
How to use Bollinger Bands?
Application of Bollinger Bands
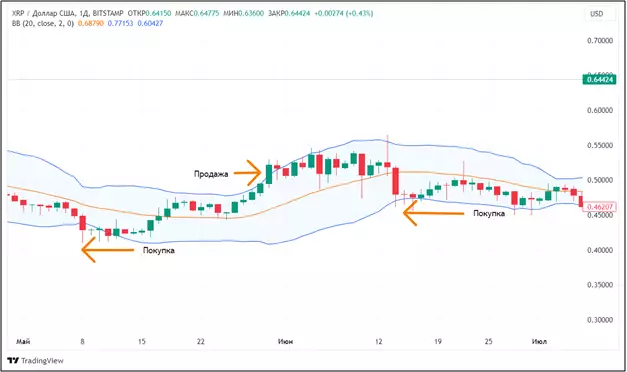
The use of the indicator will be different for sideways and trending movements. In the first case, the price of the cryptocurrency will mostly not go beyond the channel (beyond the boundaries of the moving average shifted by several deviations). In this case, the tactics are very simple: when the price reaches the lower band, buy. When you reach the top – sell. In this case, the slope of all three lines is practically absent.
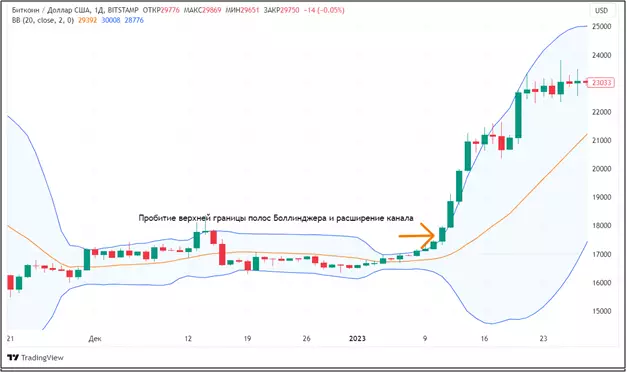
The second situation is a trend one. It is accompanied by an expansion of the channel and an increase in the slope of the median moving average. During a trend, the price can often rise above the upper limit of the Bollinger Bands (in case of a bullish trend) or below the lower limit (in case of a bearish trend). Trade in this case will be built from the median band. If we have a bullish trend, then it is a support level, and each time the price drops to it, you can buy. The reverse is true for a bearish trend. The median band is the resistance level. Each time the price of the cryptocurrency reaches it, you can sell.
At the end of the trend, as a rule, something like a flat is formed again, and the Bollinger bands narrow.
Consider a few typical examples. In May-July 2023, the Ripple (XRP) cryptocurrency had a flat (sideways movement). Accordingly, it was possible to buy when the lower band was broken and sell when the upper band was broken. In the figure below, the arrows mark the moments when it was possible to carry out transactions.

Source: tradingview.com
Now consider the formation of a trend. Let’s take Bitcoin in January 2023 as an example. Since the end of November, there has been a certain flat. On the 10th, the price goes beyond the upper limit, but there is still no channel expansion as such. But on the 11th, both factors coincided and it was possible to buy BTC. As you can see from the chart, in the future it was quite realistic to earn about 40% on the deal.

Source: tradingview.com
John Bollinger paid special attention to W- and M-shaped formations. Let’s see how it works in cryptocurrency.
W- and M-shaped models
These are two reversal patterns. W-shaped is a bullish signal. It appears when, after a decline, we reach local minima twice, and then an increase begins. The M-shaped pattern is the bearish opposite of the W-shaped pattern. Its occurrence is accompanied by a double achievement of local maxima, after which a reversal or transition to a sideways begins.
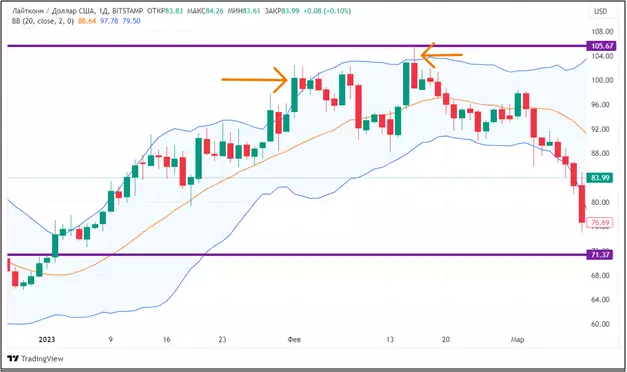
Bollinger believed that classical models of this type are obtained when the first extremum goes beyond the bands, and the second is within the channel.
A similar situation occurred with Litecoin in February 2023. Then, after the growth on February 1, the price went beyond the Bollinger bands, and on February 16 remained inside the channel. After that, the decline began.

Source: tradingview.com
Despite the popularity of Bollinger Bands, they have a number of disadvantages.
Disadvantages of Bollinger Bands
First the disadvantage is the subjectivity of the assessment. Ideal pictures, which are described by Bollinger, are extremely rare. Moreover, often they can only be obtained after the fact. When interpreting specific signals, a lot will depend on the trader. Someone will decide that, for example, the channel is narrowing or expanding, while for another it will not be a signal at all.
SecondWhat should be noted: Bollinger bands do not provide clear entry points. In general, this is intertwined with the first point. Bollinger Bands is a kind of statistical benchmark that covers 95% of all prices of a particular instrument. The trader will have to interpret it on his own. Ideally, this indicator should be combined with other technical and fundamental analysis tools.
Third minus – you will have to adjust the Bollinger bands for yourself. Those parameters that are set by default may not be suitable for a particular cryptocurrency and your trading style. To find the optimum, you most likely have to fill a single bump.
Conclusion: Bollinger Bands is a tool for measuring price volatility and determining the trend in cryptocurrency. The success of using it depends on the point settings and the trading style of a particular trader.
This material and the information in it does not constitute individual or other investment advice. The opinion of the editors may not coincide with the opinions of the author, analytical portals and experts.
Source: Bits
I am an experienced journalist, writer, and editor with a passion for finance and business news. I have been working in the journalism field for over 6 years, covering a variety of topics from finance to technology. As an author at World Stock Market, I specialize in finance business-related topics.


