
- WTI added $2.50 a barrel on Monday as energy markets re-enter.
- Crude oil markets expect a surge in summer gasoline demand.
- New weekly barrel counts from API and EIA will be closely watched.
crude oil West Texas Intermediate (WTI) The US market continued a determined recovery to start the trading week, with WTI offers crossing the $77.50 per barrel level and setting a new June high as energy traders once again place fresh bullish bets on a rush of demand. to absorb oversupplied crude oil markets.
Crude oil markets fell to new multi-month lows in recent weeks after the Organization of the Petroleum Exporting Countries (OPEC) announced a gradual removal of voluntary production limits for its extended network of allied non-member states, OPEC+ . OPEC and its consortium have been limiting production through 2023 and 2024 in an effort to curb global overcapacity, but the restricted production limits have been hitting OPEC+ nations on their government budgets, which depend on sales. of crude oil to balance their accounts.
The planned removal of OPEC+ limits coupled with an expected surge in gasoline demand that has failed to materialize at various times has left crude oil markets battered. Energy traders see renewed hope for a surge in fossil fuel use as the U.S. heads into the summer months, supported by the summer driving season and increased cooling demand.
Crude oil traders will also be keeping an eye on updated barrel counts this week from the American Petroleum Institute (API) and the Energy Information Administration (EIA), both of which noted another increase in crude barrel supply counts. The API will release its latest weekly crude oil inventory report for the week ending July 7 on Tuesday, followed by the EIA crude oil inventory change for the same period on Wednesday.
Technical outlook for WTI
US crude oil rose more than 3% on Monday, seeing its best single-day performance since early January, as WTI bids cross $77.50 per barrel again. The price action still remains on the low side of the 200-day exponential moving average (EMA) at $78.76, but is still up 8.6% in 2024.
Bidders could quickly run out of gas as WTI retreats into a near-term congestion zone above $76.50, and a decline could be in the cards if sellers return before prices reclaim the key technical zone of $80.00 per barrel.
WTI hourly chart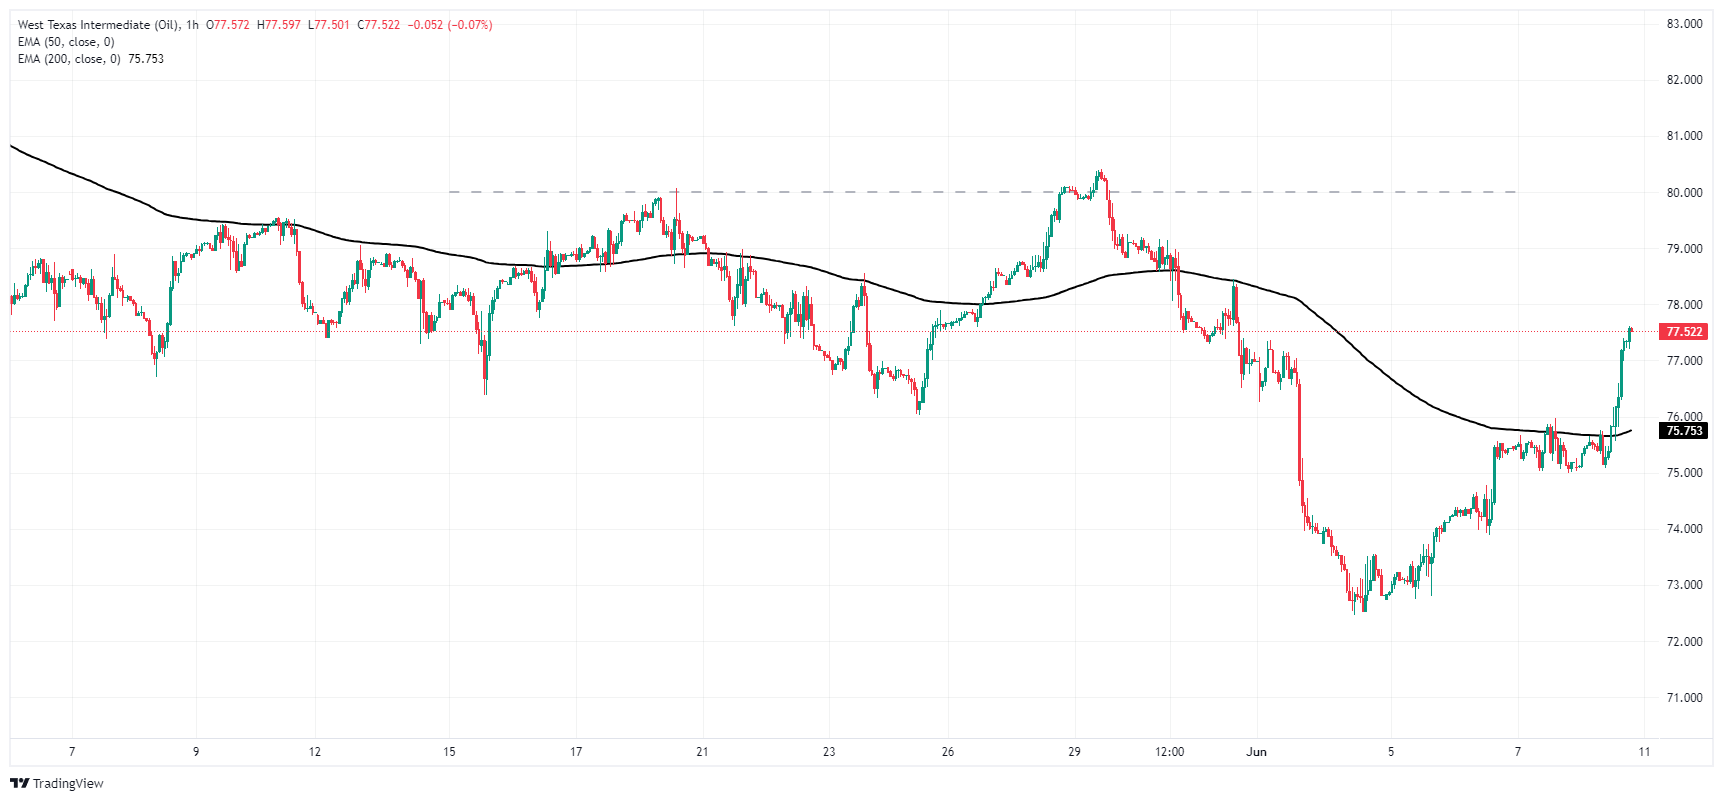
WTI daily chart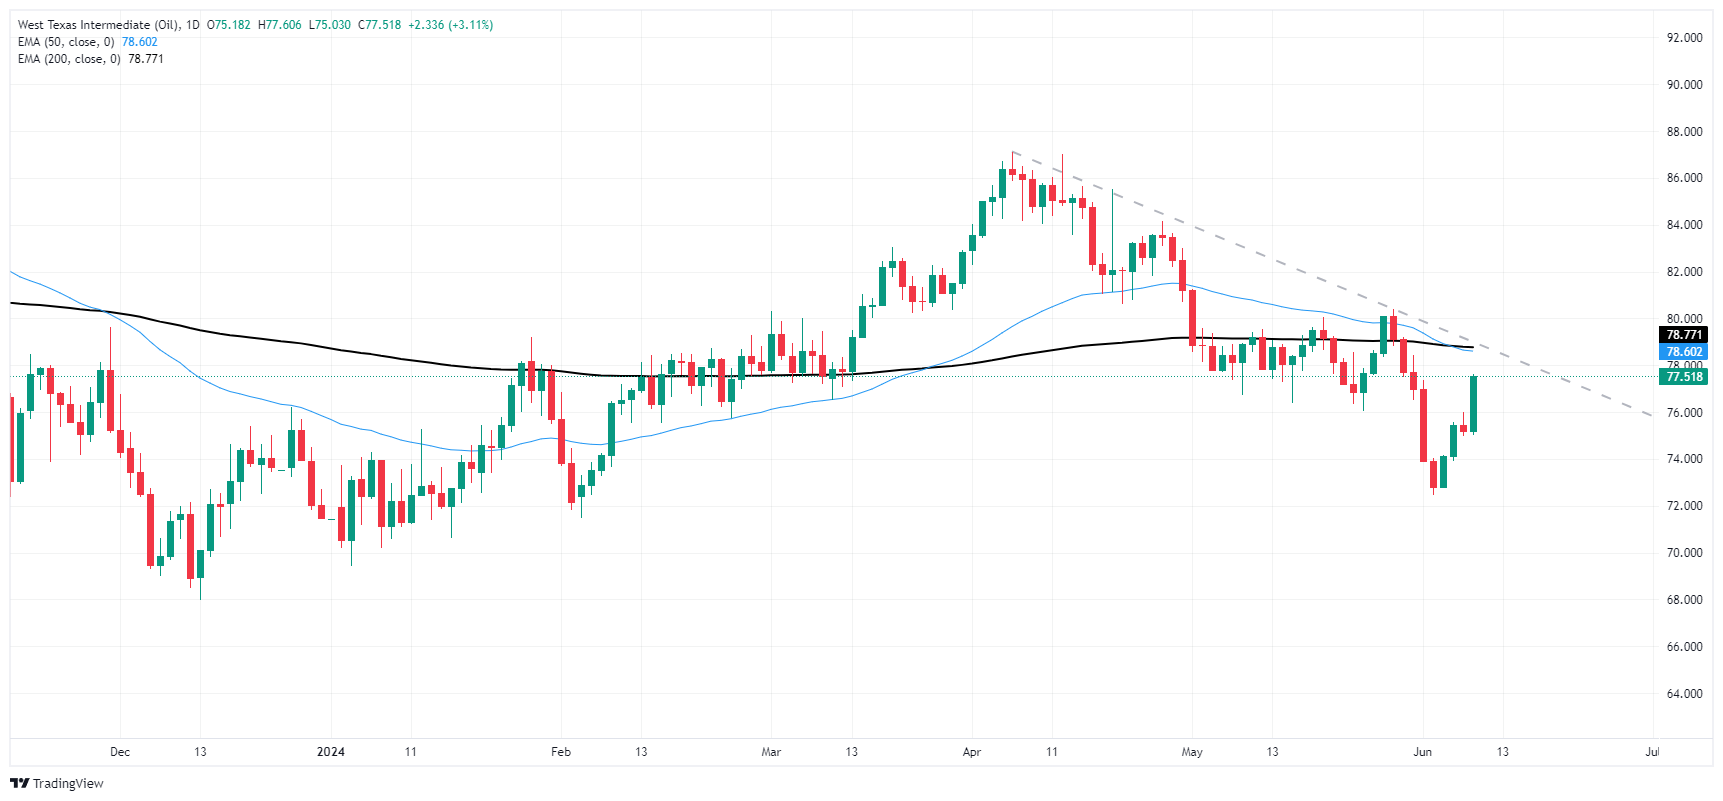
Source: Fx Street
I am Joshua Winder, a senior-level journalist and editor at World Stock Market. I specialize in covering news related to the stock market and economic trends. With more than 8 years of experience in this field, I have become an expert in financial reporting.


