
- Crude oil rises and falls again in the Energy markets.
- WTI falls to $74.50 amid exacerbated volatility in the markets.
- OPEC production cuts are unlikely to reduce oversupply amid falling demand.
West Texas Intermediate Crude Oil (WTI) is having a choppy session during the day on Friday, rising back towards $77.00 per barrel before falling once again towards $74.50 as oil markets batter. Crude oil suffered a sharp rejection on Thursday, as investors remain skeptical that the Organization of the Petroleum Exporting Countries (OPEC) can successfully execute recently announced production cuts.
OPEC recently announced a further reduction of one million barrels per day (bpd) in crude oil pumping quotas, but markets remain skeptical about the oil cartel’s ability to enforce an increasingly tight production cap. unpopular among many of its smaller constituent member states.
The lack of agreement on quantities, duration and general conditions leaves fossil fuel investors wishful thinking, as OPEC has no real method of enforcing compliance with optional cuts, which are expected to be extended. until the first quarter of 2024.
With OPEC’s meager production cut of one million barrels a day unlikely to stem the decline in global crude oil demand, the oversupply of barrels of oil is expected to worsen in the coming months.
According to the US Energy Information Administration (EIA), US crude oil reserves increased further in the week of November 24, adding 1.6 million barrels to current crude oil inventories. This figure represents a notable decrease from the previous week’s 8.7 million barrels, but still exceeds market forecasts of a reduction of 933,000 barrels.
Technical outlook for WTI
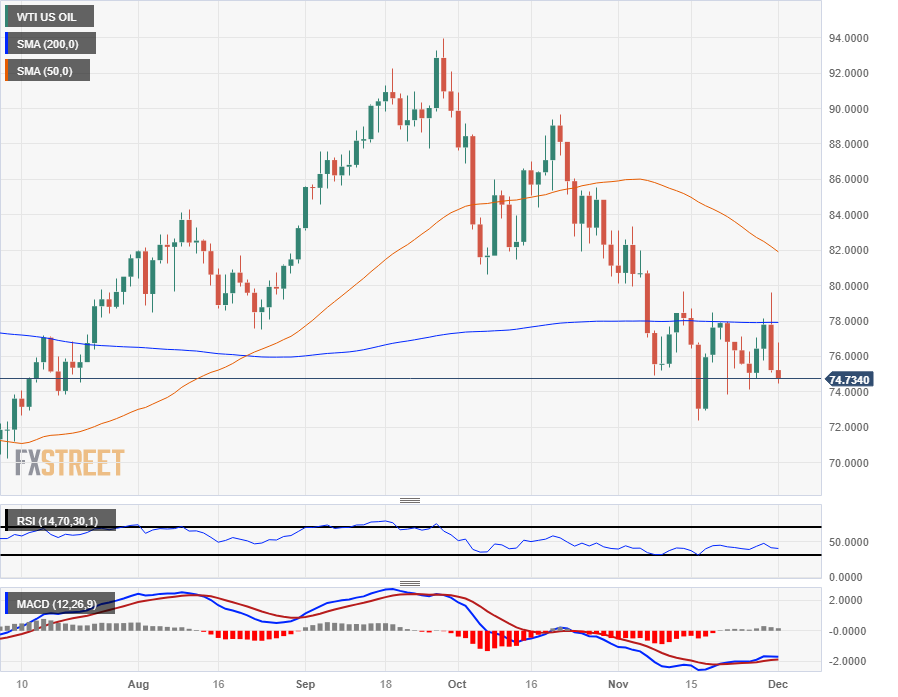
WTI crude oil is heading lower again on Friday after a cautious recovery was cut short. This week, US crude oil suffered a strong rejection from the 200-day SMA near $78.00, and WTI is heading into Friday’s close on the left foot.
Lately, crude oil is in a rough, volatile and asymmetric consolidation phase, with trading cycles between $78.00 and $75.00 per barrel. A bearish extension from here will require significant momentum to break the bearish barrier near $74.00, while a bullish turn will have to land somewhere closer to the 50-day SMA near the $82.00 area.
WTI Daily Chart
WTI technical levels
Source: Fx Street
I am Joshua Winder, a senior-level journalist and editor at World Stock Market. I specialize in covering news related to the stock market and economic trends. With more than 8 years of experience in this field, I have become an expert in financial reporting.


