
- WTI prices rose on Friday, but crude oil remains well below its recent highs.
- Market fears about declining demand have replaced fears of contagion from the Gaza Strip conflict.
- In cash, Friday’s bids are likely to be profit-taking rather than unwinding.
Crude oil prices West Texas Intermediate (WTI) have bounced 2.8% on Friday, rising from a daily low of $75.35 and testing the $77.50 level towards the close after a difficult week that has seen WTI lose 8.61%.
Market fears of an escalation of geopolitical tension in the wake of the Gaza Strip conflict have disappeared from markets and have been replaced by investor fears that global demand for crude oil will not grow as fast as many they had foreseen. The long-held assumption that global oil production would fall short of demand initially sent WTI up to one-year highs near $94.00 per barrel.
The chronic shortage of crude oil turns out to be non-existent
Despite significant production cuts by the main member countries of the Organization of the Petroleum Exporting Countries (OPEC), global demand for oil has not materialized significantly, hampered especially by the notable lack of demand for crude oil by part of China.
U.S. crude oil values declined sharply last month, but the decline is more the result of oil refiners capitalizing on rising oil prices, and crude oil values continue to rebound almost as quickly. how they decreased.
WTI Technical Outlook
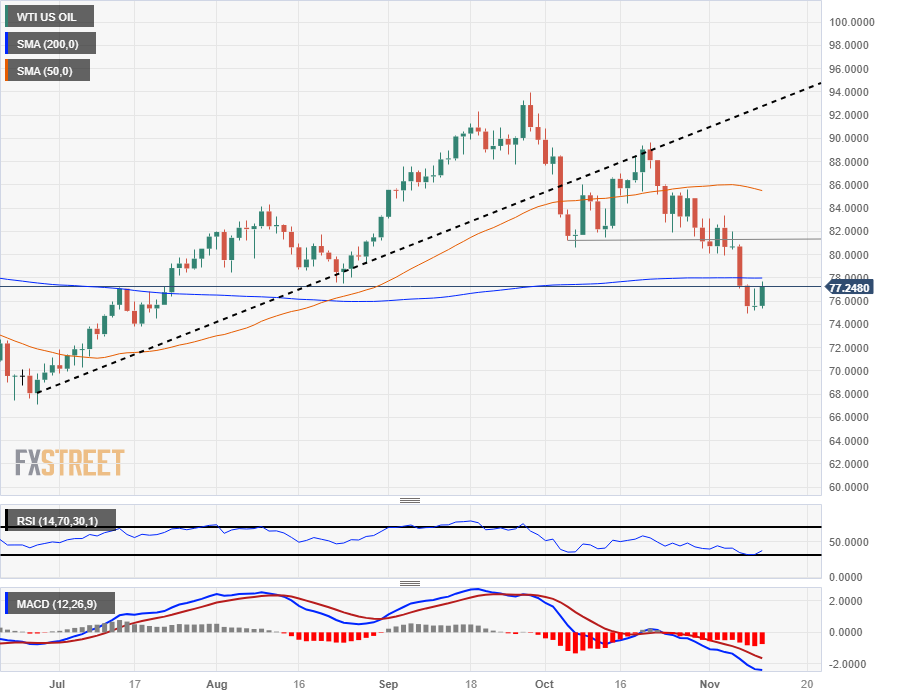
WTI has fallen 14% from the last high reached in October ($89.65) and has registered a short-term low of $74.95.
Crude oil fell towards the 200-day SMA this week, breaking through the technical barrier, and Friday’s bids are pushing WTI back toward the moving average as prices dig into the median.
The last technical low in early October, which saw congestion near the $82.00 area, has marked a potential turning point that could become technical resistance for any bullish challenge next week.
WTI Daily Chart
WTI technical levels
Source: Fx Street
I am Joshua Winder, a senior-level journalist and editor at World Stock Market. I specialize in covering news related to the stock market and economic trends. With more than 8 years of experience in this field, I have become an expert in financial reporting.


