
- Crude oil prices continue their upward trend this Monday.
- WTI is on the rise, despite concerns about tight supply.
- US crude oil is bid at its highest prices since November.
West Texas Intermediate (WTI) crude oil surpassed $82 per barrel during trading on Monday, extending its short-term bullish trend. US crude oil hit its highest level since November, hitting a 16-week high of $82.46.
Energy markets increasingly fear that crude oil supply declines will continue for the foreseeable future. Despite record oil pumping by non-OPEC countries, specifically the United States, crude oil markets are expected to suffer from supply constraints in the medium and long term, which will increase the cost of the barrel.
The American Petroleum Institute (API) will publish on Tuesday weekly crude oil inventories for the week ending March 15, which in the last edition showed a decrease of -5.5 million barrels. The change in crude oil inventories from the Energy Information Administration (EIA) will be published on Wednesday. The EIA barrel count is expected to decline by just 25,000 barrels, following the previous week's -1.5 million decline.
WTI Technical Outlook
With Monday's bullish rebound, WTI is trading above the $82.00 area, after bouncing from the previous supply zone, near $80.00 per barrel. Crude oil has gained almost 7.5% since the last low below $77.00.
Monday's bullish extension adds more momentum to the technical recovery on the daily candlesticks, after WTI crude oil bottoms near $67.85.
WTI hourly chart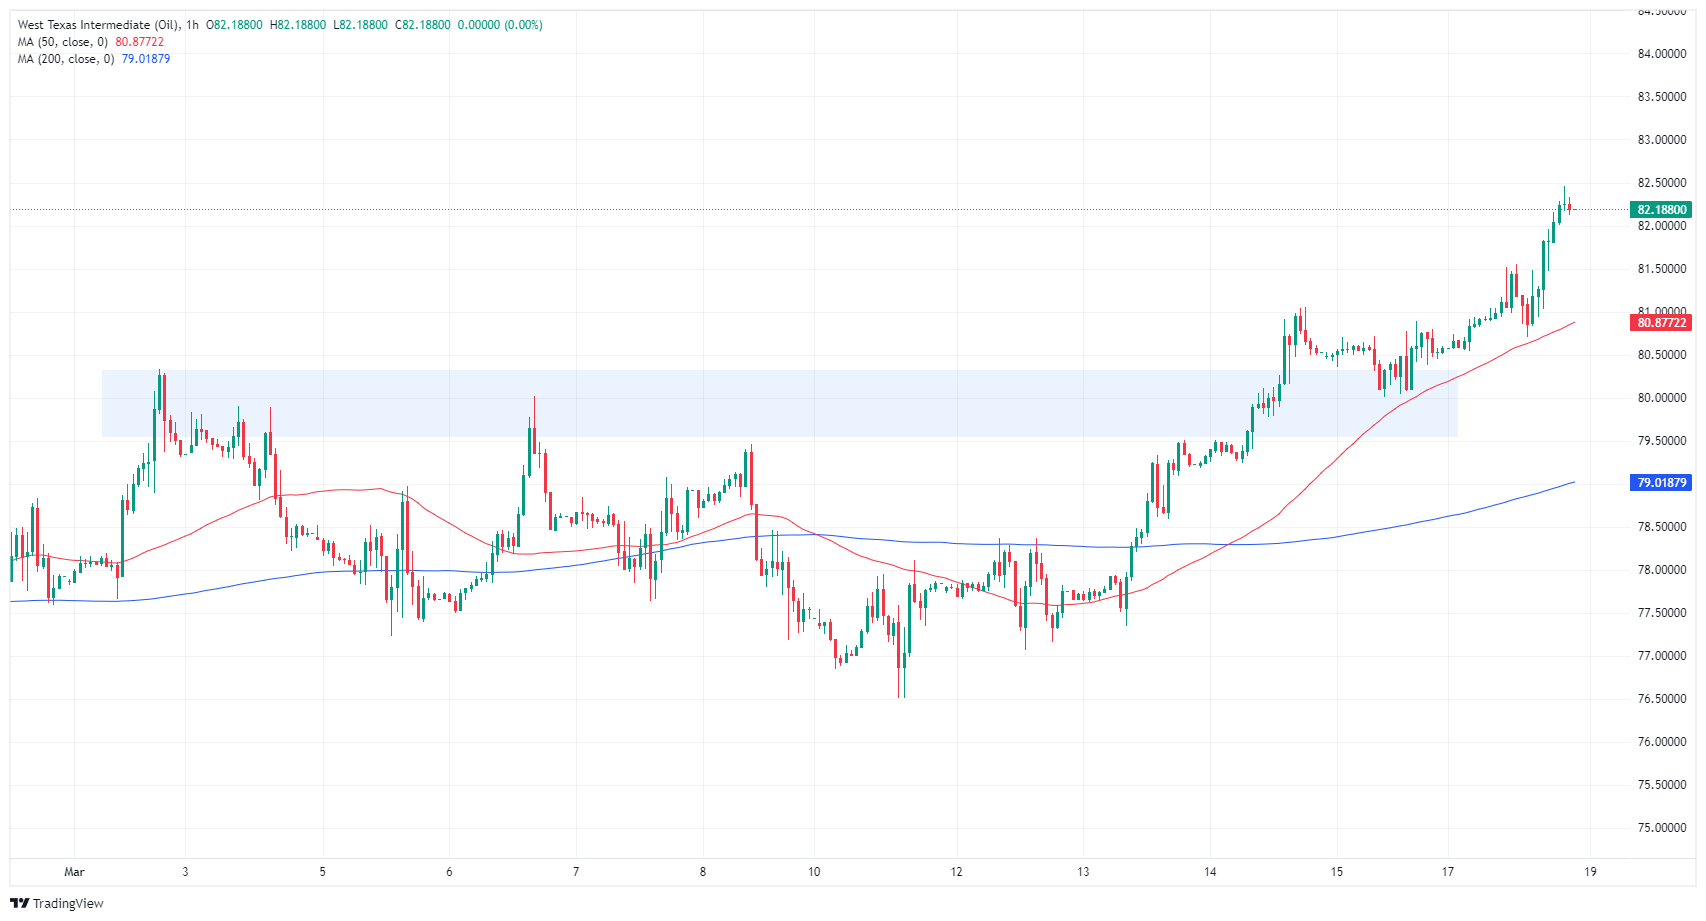
WTI daily chart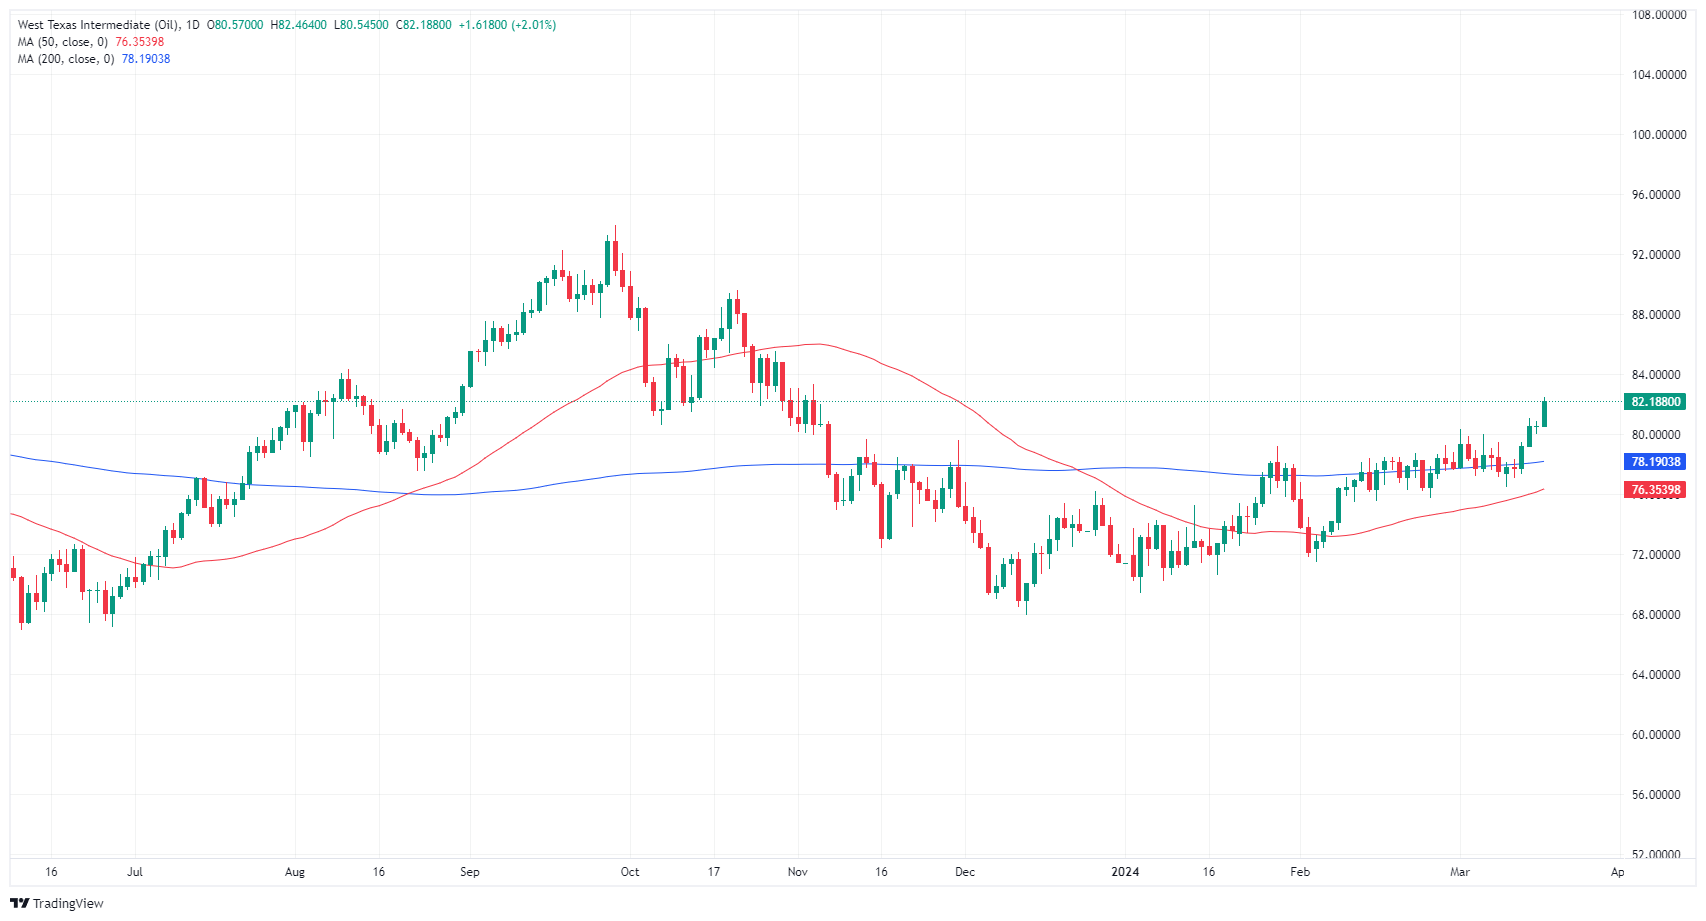
Source: Fx Street
I am Joshua Winder, a senior-level journalist and editor at World Stock Market. I specialize in covering news related to the stock market and economic trends. With more than 8 years of experience in this field, I have become an expert in financial reporting.


