- Crude oil rose on Thursday as markets reassessed growth prospects.
- The EIA revised its demand outlook, but remains behind OPEC.
- API and EIA crude oil stocks decreased this week.
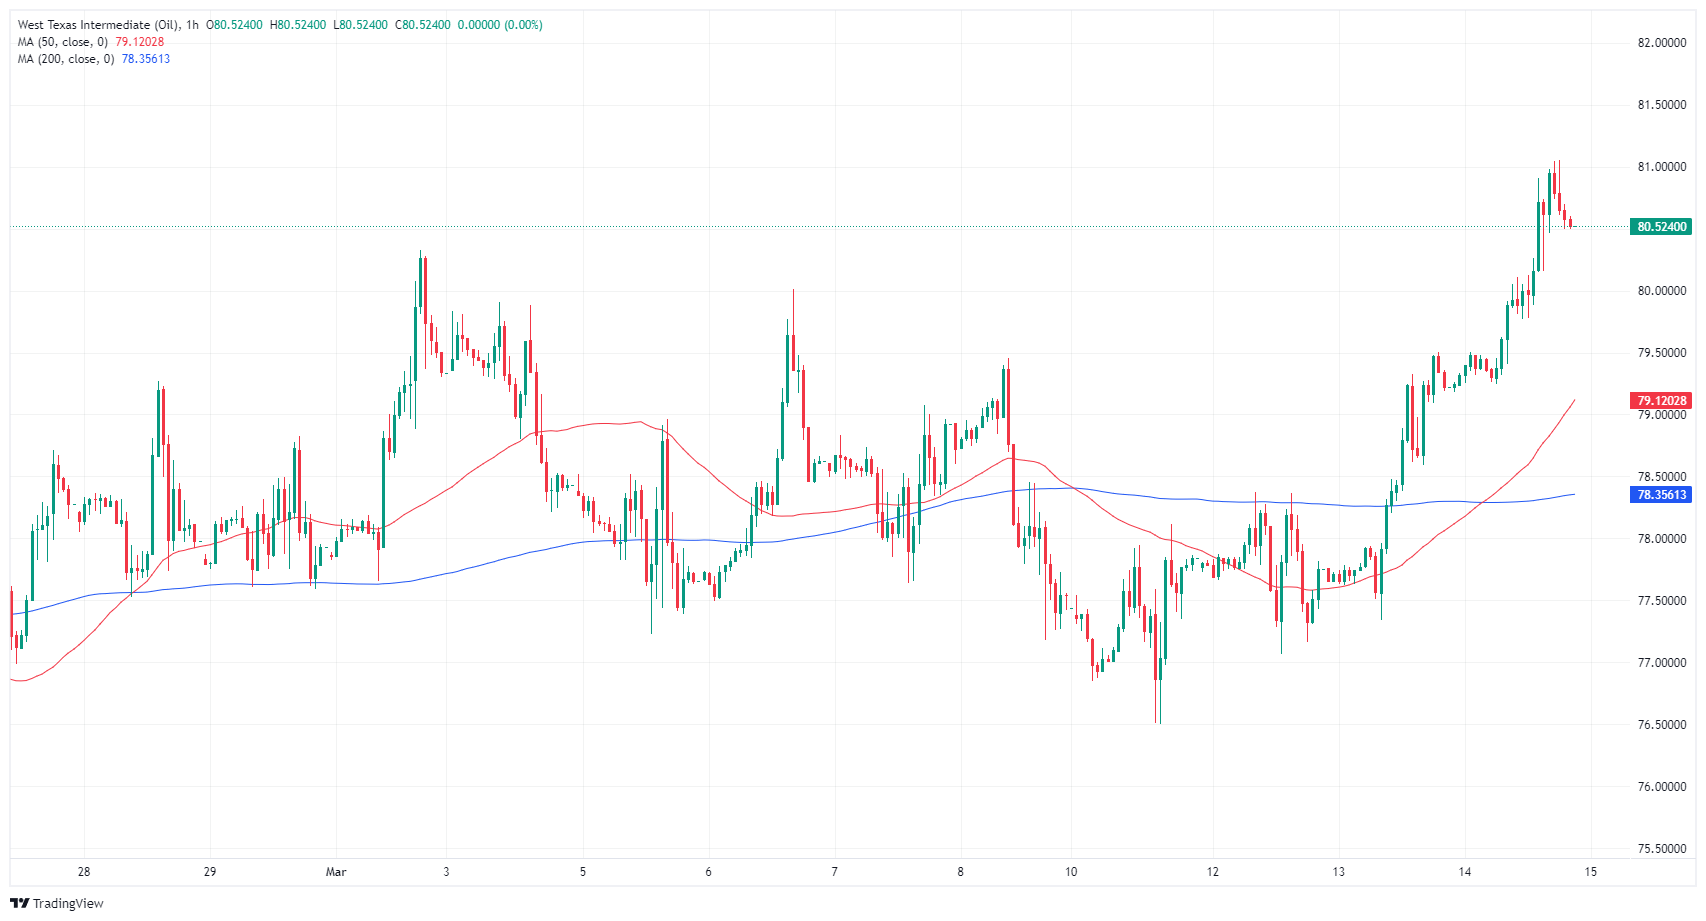
US West Texas Intermediate (WTI) crude oil hit its highest level in more than three months and hit a new high of $81.05 on Thursday, as barrel traders rebalanced their price outlook after crude oil stocks US prices fell more than expected this week and the International Energy Agency (EIA) revised its demand growth outlook upwards.
The EIA projects that global demand for crude oil will increase by 1.3 million barrels per day through 2024, which represents an increase of 110,000 barrels per day. According to the EIA, stronger demand growth from the US, as well as uncertainty surrounding attacks by Houthi rebels in the Red Sea, are increasing demand for ship fuel, as cargo ships They are diverted around the African continent to connect Asia and European markets, while Iranian-backed militants block access to the Suez Canal.
The EIA now expects global crude oil demand to average 103.2 million barrels per day in 2024, and the agency's 2025 demand growth forecasts have risen nearly 50% since they were first presented. its prospects for the first time in the summer of last year. Despite the significant increase in demand expectations, the EIA remains well below the demand forecasts of the Organization of the Petroleum Exporting Countries (OPEC), which expects crude oil demand growth to add at least 2.2 million barrels per day to current demand until 2024.
Crude oil supplies in the US fell more than expected this week as refineries started additional production. The American Petroleum Institute (API) recorded a draw of 5.5 million barrels in the week ending March 8, compared to the expected increase of 400,000 barrels, while the Energy Information Administration (EIA) crude oil stocks 1.5 million fell in the same period, well below the expected increase of 1,338 million barrels.
WTI Technical Outlook
On Thursday, US WTI crude oil hit multi-month highs of $81.50, and was as high as $81.05 before settling back down to the $80.50 level. WTI rose after bouncing from last week's low of $76.50. US crude oil has rallied almost 60%.
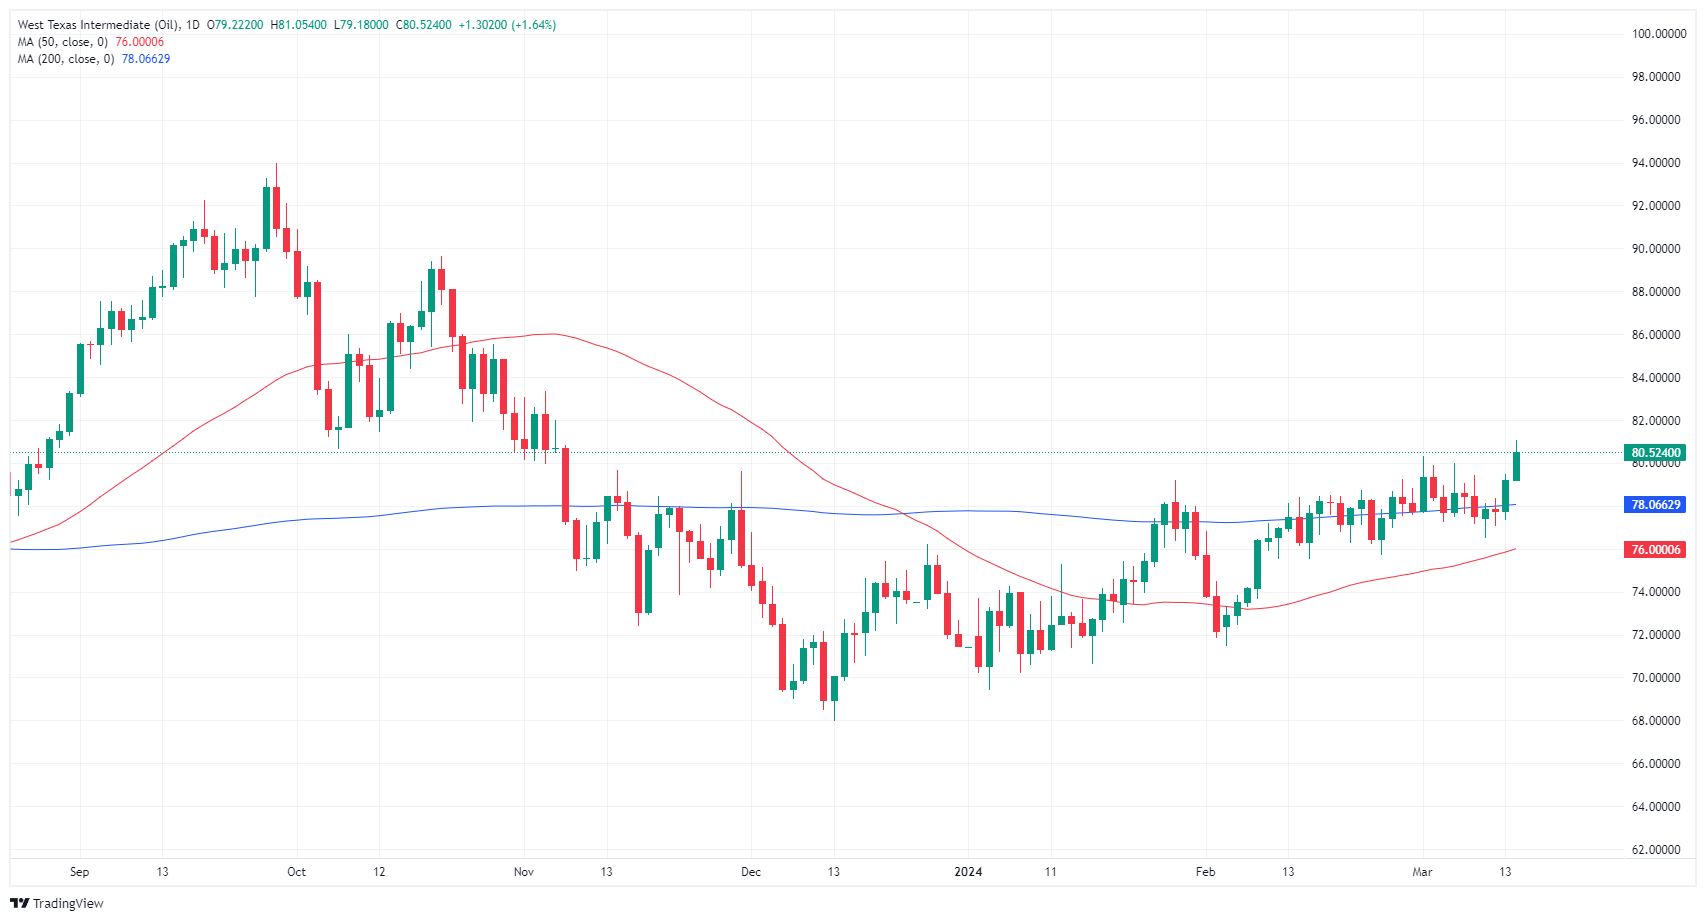
The candlesticks rose and broke the consolidation range around the 200-day simple moving average, near $78.00. US crude oil has risen almost 19% from November's low bids near $68.00 per barrel.
WTI hourly chart
WTI daily chart
WTI US OIL
| Overview | |
|---|---|
| Latest price today | 80.52 |
| Daily change today | 1.30 |
| Today Daily variation % | 1.64 |
| Today daily opening | 79.22 |
| Trends | |
|---|---|
| SMA20 daily | 78.02 |
| 50 daily SMA | 75.84 |
| SMA100 daily | 75.61 |
| SMA200 Journal | 78.02 |
| Levels | |
|---|---|
| Previous daily high | 79.5 |
| Previous daily low | 77.34 |
| Previous weekly high | 80.01 |
| Previous weekly low | 77.18 |
| Previous Monthly High | 79.27 |
| Previous monthly low | 71.46 |
| Daily Fibonacci 38.2 | 78.68 |
| Fibonacci 61.8% daily | 78.17 |
| Daily Pivot Point S1 | 77.87 |
| Daily Pivot Point S2 | 76.52 |
| Daily Pivot Point S3 | 75.71 |
| Daily Pivot Point R1 | 80.04 |
| Daily Pivot Point R2 | 80.85 |
| Daily Pivot Point R3 | 82.2 |
Source: Fx Street
I am Joshua Winder, a senior-level journalist and editor at World Stock Market. I specialize in covering news related to the stock market and economic trends. With more than 8 years of experience in this field, I have become an expert in financial reporting.


