Bitcoin
Bitcoin from August 29 to September 5, 2025 grew by 2.9%. The largest cryptocurrency in capitalization was interrupted by a series of two weeks of price reduction. BTC’s volatility remains quite low: for the last seven daytime trade sessions, the cost has not changed more than 2%.

Source: TradingView.com
The absence of a significant movement of the price of bitcoin in the week is explained by the fact that investors are waiting for data on the US labor market. According to representatives of the Goldman Sachs investment bank, the number of jobs in the non -agricultural sector of the American economy will increase by 60,000. With this development of events Expected An increase in unemployment level to 4.3%. This should not interfere with a decrease in the key rate of the US Federal Reserve at a meeting in September, which promises to positively affect Bitcoin.
Visitors to the Polymarket prediction platform agree with this point of view. The most likely option at the Fed ARESTION on September 17 will be a decrease in the key rate on 25 basic points, believes 87%.
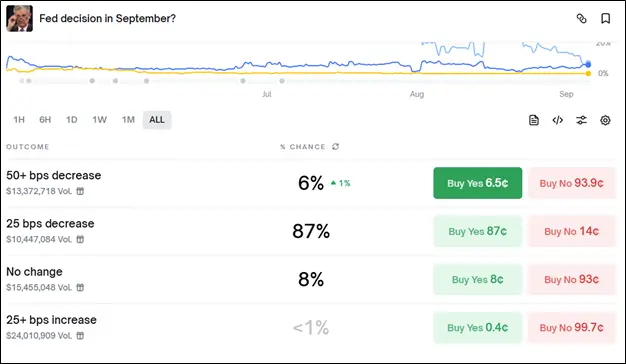
Source: Polymarket.com
Santiment analytical platform also
Notes The uncertainty on the market, paying attention to the network indicators and external signals. In particular, analysts note the shaky position of the short -term BTC holders, only 60% of which are now in profit. When Bitcoin traded at $ 108,000, there were 42%of them. Of the external factors, Santiment notes the flow of money that has significantly decreased at the end of August in the spotes ETF on BTC, as well as neutral, but in the risk zone due to a possible reduction in demand of financing rate. The key current levels of the analysts of the platform see $ 104,000 and $ 116,000.
Spot Bitcoin-ETF for the second week in a row fix the influx of cash. This time it amounted to $ 406.6 million. Although the indicator is far from the maximum values of 2025, the Bitcoin’s spinal stock funds were able to interrupt the six -week series, where they showed the worst dynamics regarding the air.
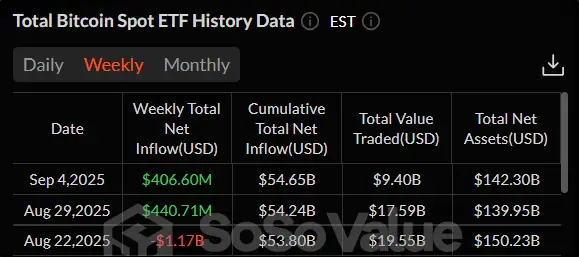
Source: sosovalue.com
From the point of view of technical analysis, the Bitcoin trend is descending. This is due to the fact that the price is below the 50-day sliding average (indicated in blue). Nevertheless, not everything is so sad. A positive signal for buyers (bulls) was given by the Stohastik indicator, which came out of the resale zone. Now it is important Bitcoin to gain a foothold above the level of $ 112,000. If it is possible to implement, then growth is quite possible – $ 117,421. In case of failure, the fall to support will most likely take place – $ 108,000.

Source: TradingView.com
Fear and greed index
decreased For two points compared to last week. The current value is 48. This indicates a neutrality in the moods of crypto investors.
Ethereum
Air from August 29 to September 5 demonstrated near -headed dynamics. The price froze just above $ 4300. Five of the seven trading sessions ended for ETH in the plus. Nevertheless, the maximum price growth in the results of the day has never reached even 3%.
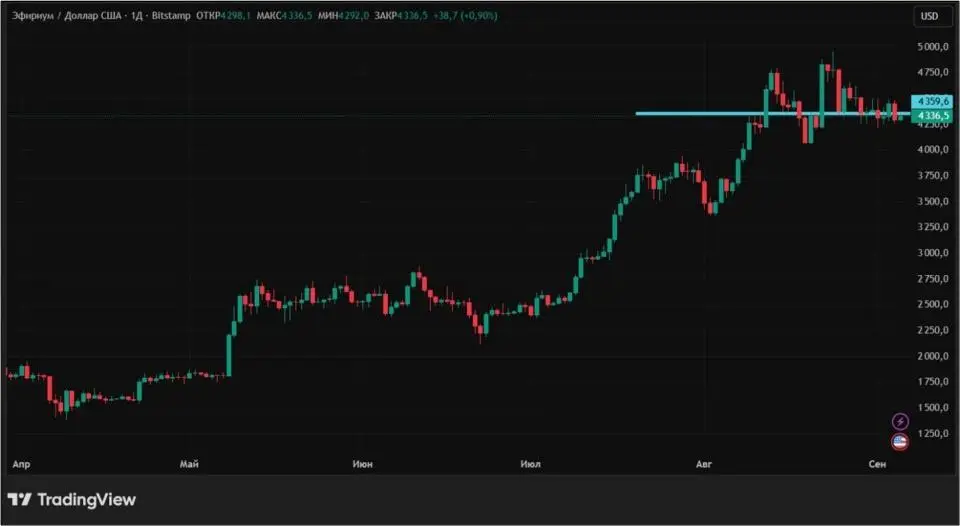
Source: TradingView.com
Despite the outlined correction, the ether continues to set records for individual indicators. For example, the ETH trading volume on centralized exchanges (CEX) in August ($ 479.56 billion) for the first time in seven years surpassed a similar indicator of bitcoin ($ 400.63 billion). The main drivers of this event were massive formation of business reserves, as well as the demand for spotes ETH-ETF.

Source: Theblock.co
Important: although the trading volume of the ether is growing, its reserves on cryptocurrency exchanges fall. According to the analytical platform Cryptoquant, now the reserves of trading platforms = a little more than 17.3 million ETH. Since the beginning of the year, about 2.7 million coins have been withdrawn from the crypto -streak. The indicator of the broadcast of the broadcast on trading floors reached its minimum in three years. This state of affairs usually indicates that investors prefer to save ETH, and not trade in it. As a rule, such a signal portends further cost.
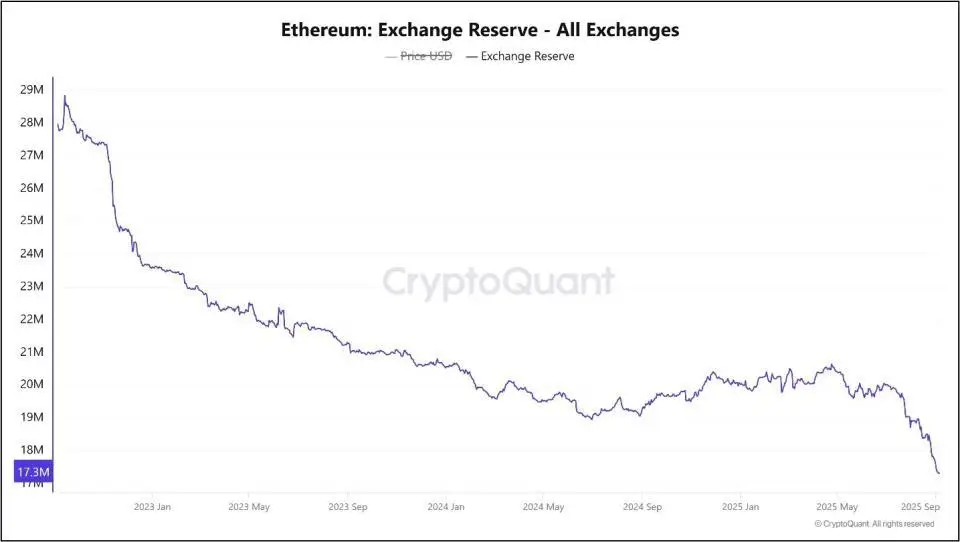
Source: Cryptoquant.com
But for spotal ETF on air, autumn began with a weekly outflow of funds of $ 341.02 million. Throughout three trading sessions, investors removed their assets from exchange funds on air.
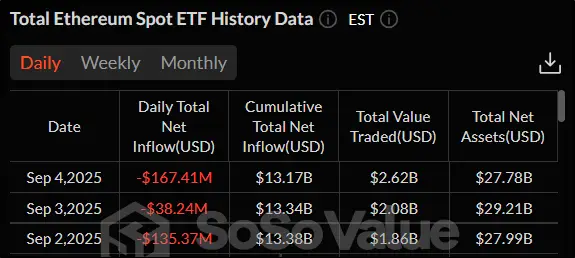
Source: sosovalue.com
From the point of view of technical analysis, the long -term trend of the ether remains ascending. This is confirmed by the fact that the price is still located above a 50-day sliding average (indicated in blue). Also, the fact that RSI is reduced from the positive can be noted from the positive, but the values of 50 are higher. The current levels of support and resistance to daily schedule: $ 4064.1 and $ 4955.3, respectively.
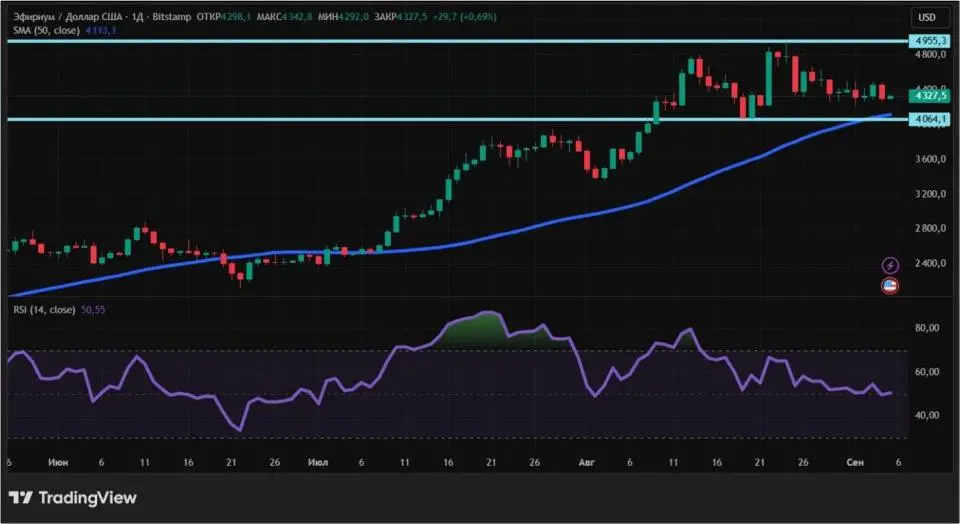
Source: TradingView.com
Chainlink
Chainlink for a week from August 29 to September 5 decreased by 3.72%. After this cryptocurrency on August 22 showed a maximum of a year, its cost has been falling for the second week in a row. The greatest sales were observed on Thursday, September 4, when Link decreased by 5.82%.
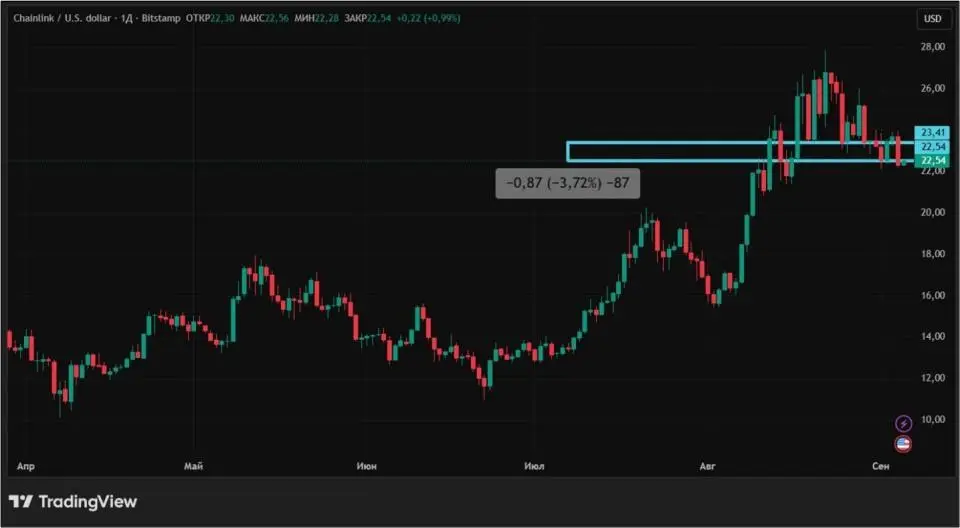
Source: TradingView.com
Chainlink Reserve – Link Token reserve was replenished by another 43,937 coins. In total, it now has 237,014 coins with a total of $ 5.4 million. The average purchase price of one Link is $ 22.19, which is only 2.6% lower than the current market value.
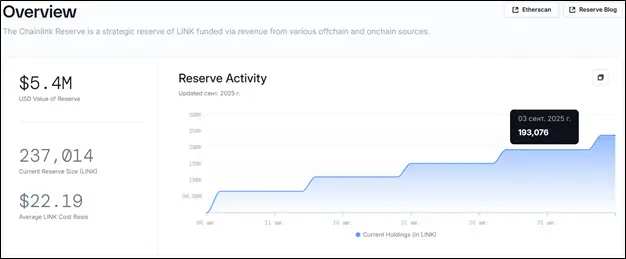
Source: Metrics.Chain.Link
ALPHRACTAL analytical platform
She shared Information about the ongoing increase in the number of chainlink wallets containing from 100,000 to 1 million coins. This shows: large players believe in the long -term increase in the cost of this cryptocurrency. In addition, Alphraactal noted that the average cost of the last movement of all Link in circulation is $ 15.1 – 33% lower than the current market value. By
opinion Analysts of the platform, this mark will be a strong level of resistance in case of possible correction.
But there are some disturbing signals. Analytical platform Santiment
Noticedthat now more than 90% of Link, who are in circulation, make profit to their owners. It is quite obvious that CHINLINK correction is just around the corner, since a number of investors will prefer to fix the profit.
From the point of view of technical analysis, the ChainLink trend is ascending, since the price is located above a 50-day sliding average (marked in blue). But the volatility of the cryptocurrency falls due to the reduction in the ATR indicator. The nearest levels of support and resistance on the day schedule: $ 21.4 and $ 27.86, respectively.
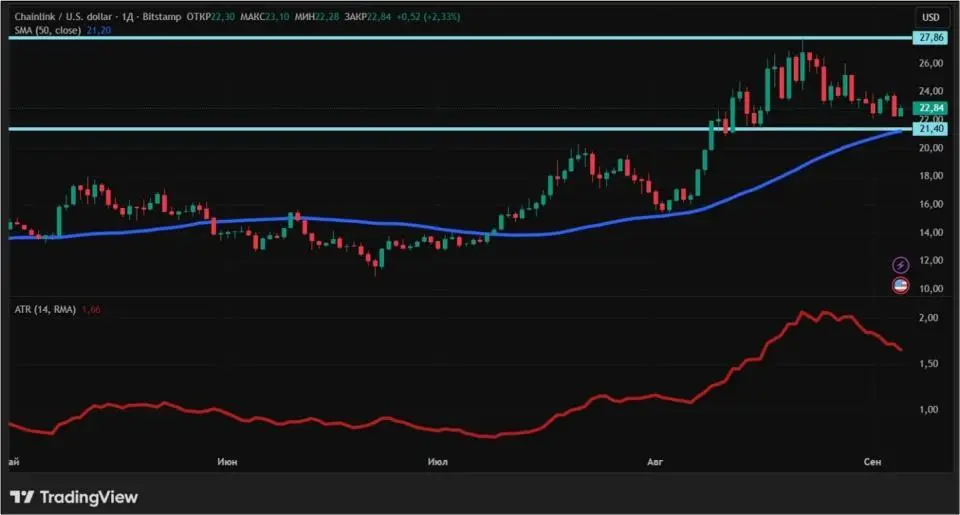
Source: TradingView.com
Conclusion
Thus, the dynamics of the largest cryptocurrencies in early autumn is the most diverse. Traiders and investors froze in anticipation of a decision on the interest rate of the American Central Bank – the US Federal Reserve. If the rate drops, loans will become cheaper, and more borrowed money will appear on the world market.
This material and information in it is not an individual or other other investment recommendation. The view of the editorial office may not coincide with the opinions of analytical portals and experts.
Source: Bits
I am an experienced journalist, writer, and editor with a passion for finance and business news. I have been working in the journalism field for over 6 years, covering a variety of topics from finance to technology. As an author at World Stock Market, I specialize in finance business-related topics.


