In this technical blog, we will analyze the past performance of the Elliott wave charts of the DAX index. We introduce members to the elliottwave-forecast. In which, the rally from the low of October 23, 2023 ended as an impulsive structure. But it showed a sequence of higher highs within the higher time frame charts, favoring further upward extension. Therefore, we advise members not to sell the index and buy on the dips in 3, 7 or 11 moves in the blue box areas. We will explain the structure and forecast below:
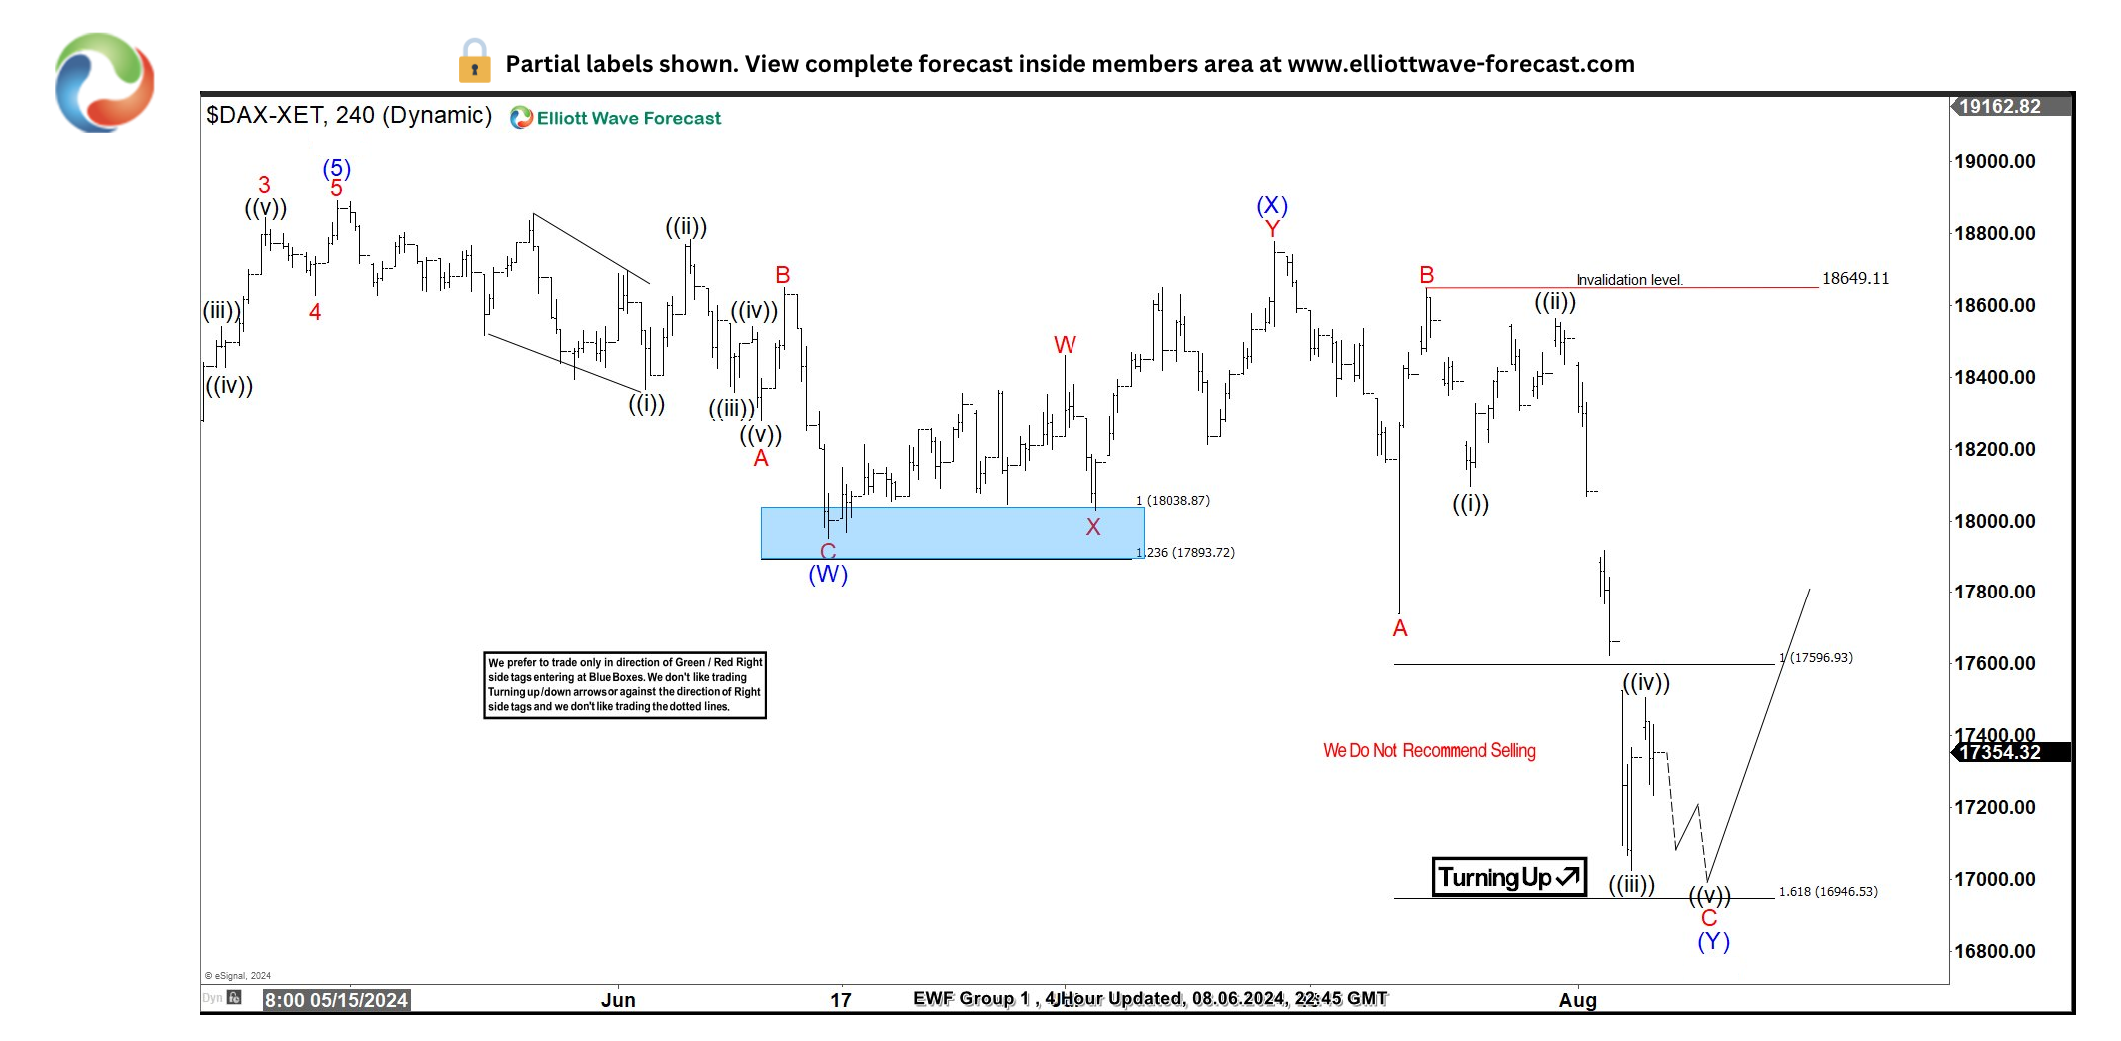
DAX four-hour chart from the update of 8.06.2024
Here is the 4-hour Elliott wave chart of the update on 8.06.2024. In which, the cycle from the 23.10.2023 low ended as an impulsive structure at the high of 18,892.92. From there, the index made a pullback to correct that cycle. The insides of that pullback developed as a double three Elliott wave structure where wave (W) ended at the low of 17,951.17. While the bounce from wave (X) ended at the high of 18,779.40. Then, wave (Y) managed to reach the extreme equal-leg area at 17,596.93-16,946.53. From there, buyers were expected to appear looking for the next leg up or at least a 3-wave bounce.
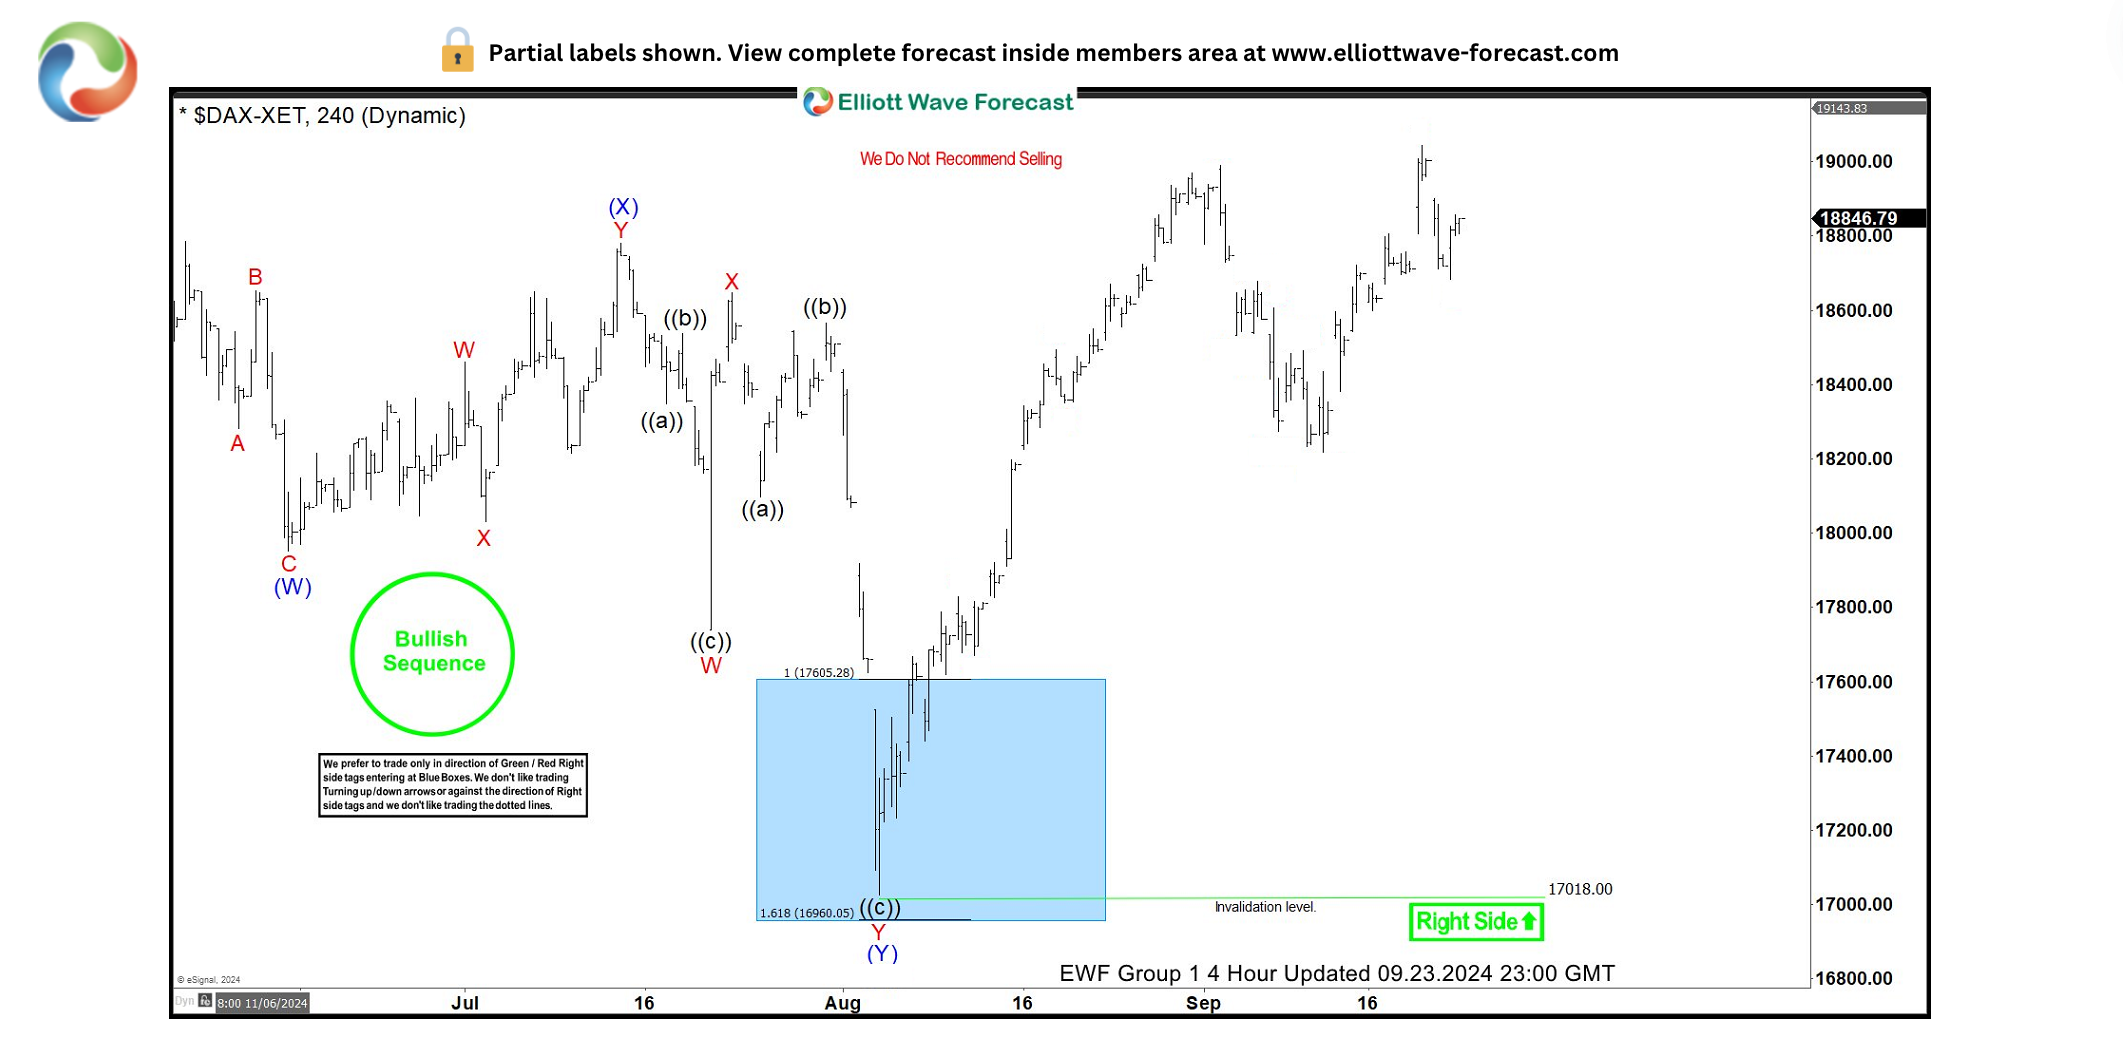
Latest four-hour chart of the DAX from the update of 23.09.2024
This is the last 4-hour Elliott Wave chart of the update on 23.09.2024. On it, the index shows an upward reaction taking place right after the correction ended within the extreme area. It allowed members to create a risk-free position shortly after taking the long position in the blue box area. Since then, the index has already made a new high above the high of 18,892.92, confirming the upcoming upward extension.
Source: Fx Street
I am Joshua Winder, a senior-level journalist and editor at World Stock Market. I specialize in covering news related to the stock market and economic trends. With more than 8 years of experience in this field, I have become an expert in financial reporting.


